Rising residential electric bills are fast becoming one of the top political issues in both state and federal elections. Predictably, each side of the debate is quick to blame their opponents for policies they hate but that have nothing to do with increases in residential electric rates. But rather than deconstruct their misinformation, let’s just start with the facts.
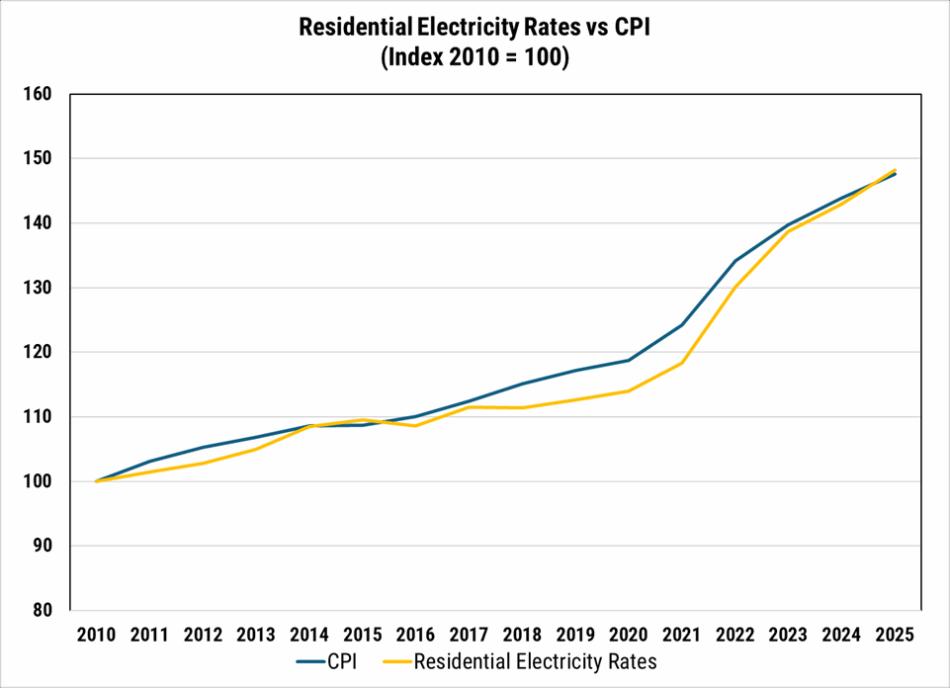
- Fact Number One: Over the last 5, 10, and 15 years, residential electric rates in the U.S. are up in line with inflation.
- Fact Number Two: The largest contributor to rate increases is not the cost of generating the power nor the cost of transmission over long distances. It is the cost of distribution, that “last mile” of poles, wires transformers and substations to the end user which requires the most repair and maintenance and the most accounting, administration and management (i.e. overhead).
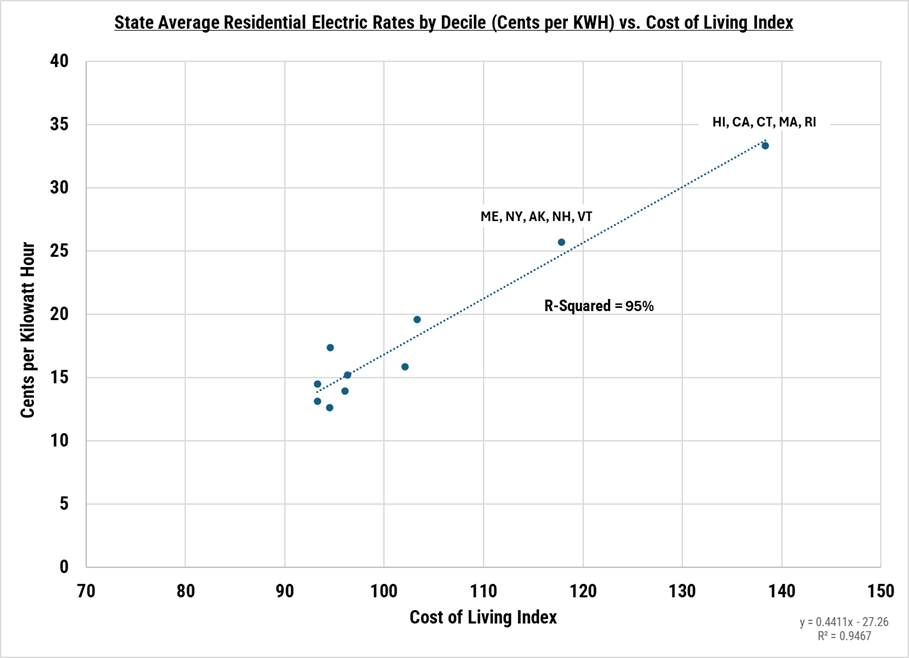
- Fact Number Three: The wide dispersion in electricity rates between states has a 95% correlation to the cost-of-living index in each state, not whether it is red or blue and not whether they have a renewable or clean energy mandate.
Here is the data.
Exhibit 1 Residential Electricity Rates vs Inflation 2010-2025

Source: EIA, Federal Reserve Bank of St. Louis (FRED – Federal Reserve Economic Data), EIP Estimates
While residential electricity rates have increased faster than inflation since COVID, the longer-term trend is more instructive and indicates that nothing is structurally out of whack with residential electricity costs. Nonetheless, it’s instructive to look at a breakdown of the three main cost components of residential electricity prices.
The table below shows average U.S. residential electricity rates broken down by its three main components – generation, transmission, and distribution – every five years going back to 2010 compared with increases in the CPI:
Exhibit 2: Changes in the Components of Residential Electricity Rates

Source: EIA, Federal Reserve Bank of St. Louis (FRED- Federal Reserve Economic Data), EIP Estimates
2025 CPI based on consensus estimates.
2025 power prices are estimates based on inflation, wholesale power prices and natural gas prices.
Over the last ten years, the price of residential electricity has risen from about 12.7 cents to about 17.1 cents per kilowatt hour, assuming 3.7% inflation for this year.[i] Around 65% of the increase is from distribution costs which account for 2.9 of the 4.4 cent increase. Generation (0.9 cents) and transmission (0.6 cents) make up the rest. [ii]
The prevailing narrative is that wind and solar have been the drivers of these cost increases. But since wind and solar – even without subsidies and tax credits – are the cheapest form of new capacity, this argument doesn’t work.[iii]
Aha! say the detractors, but that is before including the cost of new transmission lines to wind and solar farms in remote locations and backup power in the form of batteries or new natural gas-fired generation. On this, they are correct.
The industry got in the habit of measuring the cost of electricity to the producer of the power, not to the network as a whole, which may include extra costs for transmission and backup power. The metric in the industry has been “levelized cost of energy” (LCOE) which is the price of wholesale electricity needed for a 10% cash-on-cash return to the owners. Instead, we should measure “levelized impact on network costs” or “LINC” (I want a copyright for that if it catches on). Only then are we truly accounting for the cost of each source of electric power.
Nonetheless, the cost increases in generation and transmission belie the importance of this effect on overall prices to the residential customer. Even if we make the extreme assumption that ALL incremental generation costs over the last ten years were due solely to the cost of backup generation and ALL the incremental costs of transmission were due to connecting remote wind and solar, that would explain only 1.5 cents of the 4.4 cent increase. Neither of those costs would accrue to the distribution category.
The next exhibit breaks down the contribution of cost increases from generation, transmission and distribution over 5, 10 and 20 years, illustrating that this basic pattern is the same no matter which time frame is analyzed.
Exhibit 3: Contribution to Price Increase for Residential Electricity

Source: EIA, Federal Reserve Bank of St. Louis (FRED- Federal Reserve Economic Data), EIP Estimates
2025 CPI based on consensus estimates.
2025 power prices are estimates based on inflation, wholesale electricity power prices and natural gas prices.
The importance of the cost of distribution in understanding price increases is due to two factors, its size and its labor component. In 2010, distribution costs made up 43% of the residential bill but accounted for 56% of the cost increase since then. Generation and transmission, by their very nature, are capital intensive activities where the recovery of that capital cost makes up the vast majority of its annual cost. It is at the distribution level where a utility’s wages for operations and maintenance (think: highly skilled, expensive lineman driving expensive trucks), administration and management are added to the bill. And those wages tend to rise with inflation. Include medical and pension benefits and they rise faster than inflation.
And let’s not forget that while we have some deregulated electric power markets in the U.S., ALL transmission and distribution is owned and operated by utilities that have been granted a monopoly and operate on a cost-plus revenue model that ensures they earn their allowed returns on equity. Therefore, price increases for distribution and transmission are a direct result of passing through each utility’s costs and not an expansion of margins.
This is not to say that going forward the cost of generation won’t rise. The cost inflation for new equipment like gas-fired generation units and the higher cost of maintaining a cushion of spare capacity already indicate that generation costs are likely to continue to rise. But cost inflation is economy-wide and not isolated in the power sector.[iv]
We can also see the impact of distribution costs when we compare residential electricity rates by state. States with the highest cost-of-living also have the highest residential electricity rates.
Exhibit 4 shows there is a 95% correlation between residential electricity rates and the cost-of-living index by decile.
Exhibit 4: Residential Electricity Prices vs Cost-of-Living Index – By Decile

Source: EIA and the Missouri Economic Research and Information Center
It’s no surprise which states have a high cost-of-living index: California, New York, Massachusetts, etc. One narrative out there blames the high cost of power in these blue states on their renewable mandates. The trouble with that narrative is that while there is a wide variance in residential rates between the states, there isn’t a wide variance in wholesale power prices. Wholesale power prices over the last three years in any one region of the country do not vary from the national average by more than 1-2 cents per kilowatt hour[v].
Moreover, how do we account for the fact that Iowa has the 15th lowest residential rates among the 50 states yet was the first to establish a renewable power requirement all the way back in 1983. Or bluer than blue Washington state, with the 11th lowest residential rates?[vi]
The advent of competitive markets in electric power where any merchant generator – including intermittent renewables – can sell their electrons has contributed to a 60-70% decline in real wholesale power prices in the U.S. over the last 40 years when the de-regulatory process began[vii]. But since those generators have no obligation to serve, and no responsibility to maintain grid reliability, we have need of another non-market structure, the vertically integrated utilities operating under a cost-plus model. Each part of this system generates about half the electric power in the U.S. And while it is true that the more intermittent wind and solar merchant operators put on the grid, the more transmission and back-up power the vertically integrated cost-plus utilities have to add, a system that is entirely competitive and efficient will not be reliable and a system that is entirely cost-plus monopolies will not be cost effective. We need both.
But if we want to lower prices, look not to the wholesale generation component of 7 cents. Look at the distribution component which is owned and operated exclusively by cost-plus monopolies that are incentivized to grow their investment base, so they can grow earnings for their shareholders, but are not incentivized to lower operating costs. This is where we need reform. Let the utilities (and by extension, their investors) keep a portion of the operating costs they save for a few years– allowing a temporary increase in their allowed returns on equity – and watch the costs come down.
Check out the EIP Expert Corner for short videos from EIP’s Thought Leaders.
This information presented contains EIP’s opinion which may change at any time and without notice. The information provided above is based on data obtained from third party publicly available sources that EIP believes to be reliable, but EIP has not independently verified and cannot warrant the accuracy of such information. In providing the information, EIP has made several assumptions that if changed, materially affect the information and conclusions provided. The above includes publicly available information about certain companies. EIP may or may on invest in such companies. The information provided is for informational purposes only and is not an offer to purchase or sell particular securities or securities of a particular company. Investors are encouraged to do their own research and consult with their own advisors prior to making an investment decision. Past performance is no indication of future performance.
[i] Average prices in May of 2025, the last month for which we have data, is 17.4 cents per KWH, but since then natural gas prices which – makes up over 40% of generation – are down about 25% since then. Source: EIA.
[ii] Source: EIA, Federal Reserve Bank of St. Louis (FRED- Federal Reserve Economic Data), EIP Estimates
[iii] See Lazard’s 2025 LCOE Analysis of electric power costs at the wholesale level. Assumes ample supply of wind and solar power.
[iv] The well publicized prices for the capacity auction in the PJM region is a market-based mechanism to ensure spare capacity. The regional and federal mandates that require certain unprofitable existing fossil fuel plants continue to run to ensure reliability and pass along their uncompetitive costs to the public are another source of upward cost pressure.
[v] Source: S&P Global ISO Real Time, EIA
[vi] Source: https://www.saveonenergy.com/electricity-rates/electricity-rates-by-state/, IEA
[vii] Source: EIA