The outperformance of the energy sector over the last three years is being driven by much more than unrest in the Middle East and Ukraine. It is being driven by three large forces:
- Continued global growth in demand for oil and gas demand both of which we believe will hit record highs in 2024 – defying the consensus predictions of energy-transition driven declines.
- Lagging supply growth resulting from a halving of capital spending over the last 6-7 years, driven by a shareholder revolt seeking an end to wasteful capital allocation during the shale boom.
- Dramatically higher per share profitability for any given oil/gas price resulting from cost-cutting, debt paydown and share repurchase.
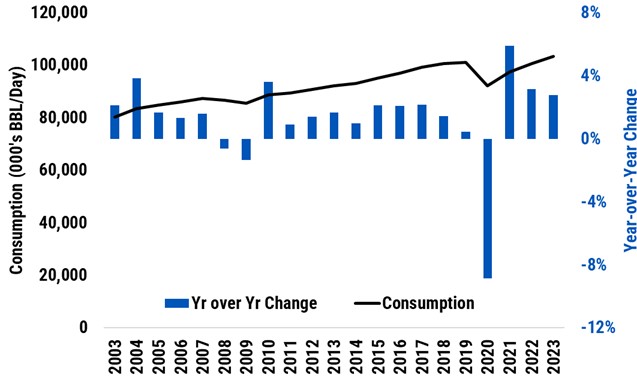
- Demand has been underestimated by the consensus
Global Oil and Liquid Petroleum Demand 2003-2024

Source: 2024 Energy Institute Statistical Review of World Energy, June 2024.
Oil and gas demand grows at about half the rate of global GDP. While this ratio has fallen steadily as the world’s economy becomes more service oriented, alternative forms of “clean” energy have barely made a dent.
Here’s why.
Only 4% of global oil demand is for electricity and so wind/solar/batteries have virtually no impact on oil demand[1].
Electric vehicles have had an equally small effect, as passenger vehicles, (which make up about 25% of global oil demand,) have a scrappage rate of only 4% per year. So even if ALL new passenger car sales were electric starting tomorrow, it would take 25 years to replace the existing fleet. Meanwhile, the other 75% of oil demand keeps growing as it has few alternatives over the next 10-15 years[2].
Natural gas continues to grow with GDP and will, in our opinion, increasingly be needed to back up intermittent wind and solar, replace aging/retired coal plants and – in the US – feed growing LNG exports.
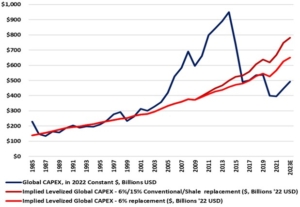
- Lagging Supply Growth Due to Low Capital Spending

Sources: Evercore ISI Research (using a compilation of Company Data, Salomon Brothers, Salomon Smith Barney, Lehman Brothers, Barclays Capital, and Evercore ISI Research estimates), U.S. Bureau of Economic Analysis, EIA, EIP estimates. Analysis is based upon a number of assumptions that if changed, could affect the analysis shown above.
Meanwhile oil and gas capital spending is below levels required to sustain production. While U.S. oil and gas production keep hitting new highs due to the low-cost position of shale, production growth elsewhere is hard to find.
The capital spending spike created by the shale boom led to returns on capital for the oil industry to fall to near zero from 10% fifteen years earlier, despite a doubling of oil prices. Shareholders revolted, voted out 3 of the 4 directors up for election at Exxon in 2021 and demanded a return OF capital rather than broken promises of a return ON capital. The graph below illustrates this.
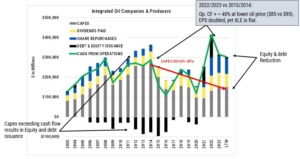
- Cost control, share repurchases and debt reduction drive higher profitability at $75 oil price
Because of this capital discipline, per-share profitability has improved dramatically. The graph below illustrates the roughly 40% increase in operating cash flow (black line), the drop in capital spending (gray area), the increase in share repurchases (blue area) and the paydown of debt (yellow area). Not shown is per-share industry profitability has doubled resulting from that 40% improvement in top line operating cash flow being burdened by less debt and fewer shares.

Source: Bloomberg. Operating CF, oil price, EPS, and XLE comparisons are 1Q2022 through 4Q2023 vs 1Q2013 through 4Q2014. Companies in analysis: XOM, CVX, RDSA LN, TTE FP, BP/ LN, COP, OXY, PXD, FANG, DVN, PR, MTDR, APA, CNQ CN, SM, MRO, EQT, RRC, AR, CHK, SWN, CNX, CTRA, OVV, HES, EOG, MUR, CRK, GPOR. Capex is capital expenditures. LTM is last twelve months. The information is provided for investment purposes only. EIP may or may not have invested in the companies contained in the analysis and EIP clients may or may not have had the experience above.
Valuations reflect impossibly short asset life.
Despite oil and gas demand hitting new highs, despite the glacially slow pace of penetration of wind and solar and electric vehicles, the valuations of conventional energy reflect an asset life of less than 15 years. Increasingly, in our opinion, it looks as though oil and gas demand will be the same or higher in 15 years, not lower.
Yield and Valuation by Energy Business Sectors

Source: Bloomberg, Factset, and EIP Estimates based on securities held in the Energy Income Partners Strategy as of June 30, 2024. Portfolio attributes are based on the current model portfolio for this strategy and subject to change. Yield is as of June 30, 2024. P/E based on consensus 12-month earnings estimates and distributable cash flow per share. EIP in its sole discretion has catalogued the companies in the categories above, such categorizations or the company’s placement in a category may change at anytime without notice. There is no guarantee that that the strategy will achieve the dividends and earnings shown above and actual client experiences will be significantly different.
If the war in Ukraine and unrest in the Middle East play a part, it has less to do with a supply disruption than as a wake-up call to generalist portfolio managers who have gotten energy so wrong over the last three years. As they begin to look at the sector for the first time, they will see a widespread case for improved profitability that has gone unnoticed due to the focus on tech and artificial intelligence and a hollowing out of Wall Street energy research.
Rising Demand for Electric Power Shifts Sentiment for Utilities
The projected growth in electric power demand from megatrends like data centers and reshoring means the U.S. needs increasing amounts of infrastructure, power generation, and all things that feed that generation. Coal plants in the U.S. will continue to close due to age and we believe that no utility wants to build a new coal plant any more than they want to build a new nuclear plant. That leaves natural gas and renewables, the only two sources of power generation growth in the industry’s 5-year plan[3]. This means more growth for regulated utilities who are ultimately responsible for grid reliability, profitable renewable developers, and natural gas infrastructure companies that will feed growing natural gas fired power generation. Remember, regulated utilities grow their earnings by growing the investment base (called “rate base”) upon which they earn their allowed rates of return.
As data center activity grows, big tech is actively pursuing power solutions that can lower their time-to-market and secure sustainable electric power access, all of which drive up power generation and distribution growth plans. Forward power prices keep rising[4]. In fact, Amazon signed an agreement to build a data center next to a Pennsylvania nuclear facility to secure, via a long-term contract, zero-carbon 100% available electricity. Utilization rates for natural gas fired generators keep rising. Many natural gas pipeline systems are now maxed out[5].
EIP’s Portfolio invests across the entire energy universe to find the best Yield, Growth and Valuation.

The above graphs show the yield, earnings growth and valuation of the Energy Infrastructure Strategy’s current portfolio versus other sectors. Current Energy Infrastructure SMA represents the EIP Separately Managed Account current portfolio as of June 30, 2024. It should be noted that the SMA portfolio product did not exist between 2003 and 2010. This chart is provided for informational purposes only and should not be construed as an offer to sell, or a solicitation of an offer to buy, any investment and/or investment-related services. Actual client holdings during the historical periods covered by the chart above deviated significantly from the current portfolio noted above, both in terms of the names held in accounts and the respective weightings of those names as percentages of assets under management. The information shown herein was created with the benefit of hindsight and does not represent the actual client experience, which may be materially less favorable during portions and/or the entirety of the period noted above. EIP’s portfolios also present industry concentration risks that may not exist in broader-based indices. Investing entails risk including losing all of your money. Percentages are not reallocated to reflect companies that did not exist during the time period specified.
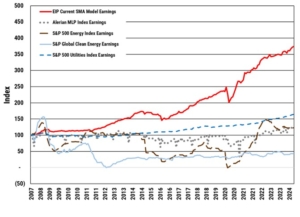
EIP finds companies with better growth and more stable earnings than any of energy’s subsectors while maintaining a portfolio with attractive valuations.

The earnings history shown represents the combined earnings history of securities currently included in EIP’s SMA portfolio as of June 30, 2024. This chart does not represent the prior earnings of any collection of companies historically held by accounts actually managed by EIP. SMA product did not exist from 2007 to 2010. EIP selected this time period because that was the beginning of the S&P Global Clean Energy Index. Percentages are not reallocated to reflect companies that did not exist during the time period specified. Information regarding comparative indices is based on the portfolio of the indices as of the time indicated in the graph. This information is intended solely to provide insights into EIP’s historical analyses of companies chosen for its current portfolio and was created with the benefit of hindsight and does not represent the actual experience of clients, which may be materially less favorable during portions and/or the entirety of the period noted above. There is no guarantee that the future earnings of any collection of companies included in EIP’s SMA current portfolio will be favorable and/or outperform the earnings measured for any index. All investments carry risk, including the potential for loss of investment principal. EIP’s portfolios also present industry concentration risks that may not exist in broader-based indices. Investing entails risk including losing all of your money.
The earnings history shown represents the combined earnings history of securities currently included in EIP’s SMA portfolio as of June 30, 2024. This chart does not represent the prior earnings of any collection of companies historically held by accounts actually managed by EIP. SMA product did not exist from 2007 to 2010. EIP selected this time period because that was the beginning of the S&P Global Clean Energy Index. Percentages are not reallocated to reflect companies that did not exist during the time period specified. Information regarding comparative indices is based on the portfolio of the indices as of the time indicated in the graph. This information is intended solely to provide insights into EIP’s historical analyses of companies chosen for its current portfolio and was created with the benefit of hindsight and does not represent the actual experience of clients, which may be materially less favorable during portions and/or the entirety of the period noted above. There is no guarantee that the future earnings of any collection of companies included in EIP’s SMA current portfolio will be favorable and/or outperform the earnings measured for any index. All investments carry risk, including the potential for loss of investment principal. EIP’s portfolios also present industry concentration risks that may not exist in broader-based indices. Investing entails risk including losing all of your money.
Energy stock price performance has lagged the fundamentals of earnings growth. There has been a mistaken view of stranded assets of utilities and pipelines which caused the price performance to lag growing earnings between 2015-2021. Recent shifts in sentiment regarding asset life has allowed prices to begin tracking earning again.
Check out the EIP Expert Corner for short videos from EIP’s Thought Leaders.
This information is based upon EIP’s opinion which may change at any time and without notice. The information provided above is based on data obtained from third party publicly available sources that EIP believes to be reliable, but EIP has not independently verified and cannot warrant the accuracy of such information. In providing the information, EIP has made several assumptions that if changed, materially affect the information and conclusions provided. Nothing in this article is an offer to sell or buy a particular company or invest or refrain from investing in a particular industry Index information is provided for information purposes only, investors cannot invest in an index. .
A description of the Alerian MLP Total Return Index and the Alerian MLP Index (AMZ) may be found at https://vettafi.com/issuer-services/indexing/energy/Alerian-Energy-Infrastructure/amz/.
Standard and Poor’s 500 Energy Index (S5ENRS) is a capitalization-weighted index. The index was developed with a base level of 10 for the 1941-43 base period. The parent index is SPXL1. This is a GICS Level 1 Sector group. Intraday values are calculated by Bloomberg and not supported by S&P DJI, however the close price in HP<GO> is the official close price calculated by S&P DJI.
Standard & Poor’s Global Clean Energy Index (SPGTCED) provides liquid and tradable exposure to 30 companies from around the world that are involved in clean energy related businesses. The index is a modified market cap weighted mix of Clean Energy Production and Clean Energy Technology and Equipment Providers companies.
Standard and Poor’s 500 Utilities Index (S5UTIL) is a capitalization-weighted index. The parent index is SPXL1. The index was developed with a base value of 100 as of December 30, 1994. This is a GICS Level 1 Sector group. Intraday values are calculated by Bloomberg and not supported by S&P DJI, however the close price in HP<GO> is the official close price.
[1] Source: EIA, IEA 2020 Key World Energy Statistics, Statista, Enterprise Products 2022 Analyst Day Deck, bp Statistical Review of World Energy – June 2022, bp Energy Outlook: 2020 edition, EIP Estimates.
[2] IBID
[3] Wolfe Research, “Power in numbers: Solar can’t save reliability alone”, September 20,2023. EIA, “Short-Term Energy Outlook”, August 2024.
[4] Source: “Unlocking Value – Cumulus Data” Talen Energy Presentation, March 4, 2024.
[5] Source: EIA.