In our first two pieces in the Power Struggle series, we analyzed the components of costs that go into the residential electric bill, how those components have changed over time, what accounts for differences among the states and how the pricing mechanism for wholesale power generation – competitive vs cost-plus – contributes to those differences. Elected officials and their appointees who are trying to address rising power bills but don’t know these basic structural attributes are more likely to propose policies with counterproductive effects.
And that’s what brings us to Power Struggle III.
State-regulated monopoly utilities are a popular target for these officials. These utilities own and operate the transmission and distribution assets in all 50 states and the power generation assets in 35 states[1]. Power generation in the other 15 states is owned by competitive “independent” power producers (IPPs)[2].
These monopolies exist to avoid wasteful duplication of capital like having three sets of poles and wires running down every street. But a monopoly is awarded only in return for 1) an obligation to provide safe and reliable service to everyone and 2) limits to shareholder returns. This is accomplished with a cost-plus revenue model whereby the companies pass along all their operating costs (including interest on debt), but retain an allowed return on equity (ROE) for their shareholders, which is set at the state level and is now coming under criticism.
The allowed ROE is determined according to an academic model known as the Capital Asset Pricing Model (CAPM) that calculates the equity cost of capital in excess of the risk-free bond rate for U.S. Treasuries. In effect, the allowed ROE adds an “equity risk premium” to the risk-free interest rate for the U.S. ten-year bond. Over the last 4 years the average earned ROE for electric utilities was about 9.0%[3], less than half of the 4-year average of 18.4%[4] ROE for the S&P 500. Yet some state-level politicians think this is too high and should be reduced to drive down electricity rates for retail customers[5].
The utilities, of course, push back against this and present their version of how the allowed ROE should be calculated, and they usually win. They win because established regulatory rules determining the allowed ROE generally cannot be changed without new legislation.
But for us the analysis is simpler.
Instead of arguing which level of equity risk premium is appropriate under the CAPM, let’s take the argument to its logical extreme by eliminating the equity risk premium altogether. Let’s assume the utilities get the same return on equity as they pay for their debt (which today is between 5-6%) and calculate how much customers would save. The answer: about 5%. Yep, that’s right, customers would only save about 5% off their monthly utility bills of about $156 per month or about $8 per month[6] or about 1 ½ pumpkin spice lattes.
Here is the math. As mentioned above, the earned ROE for the utilities is about 9.0% and the debt trades at about 5.5%[7]. Since the cost of debt would most certainly rise if the allowed return on equity were cut to 5.5%, let’s propose cutting the allowed ROE to 6.0%, which assumes the debt reprices at 6% once the equity returns have been slashed.
The table below shows the current and resulting hypothetical revenue requirement for the average utility and breaks that down into its components for each dollar of costs it incurs. And since regulated utilities operate on a cost-plus model, this required revenue is exactly what customers pay.
Exhibit 1: Cost components of Each Dollar of Average Utility Required Revenue[8]
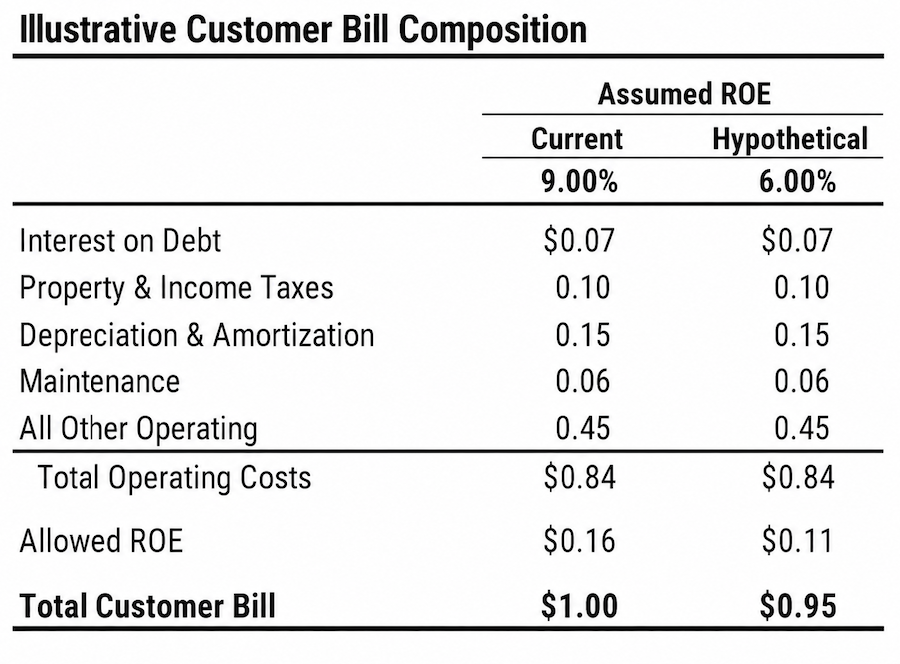
This data represents the total of all the state-level subsidiaries of all the publicly traded utilities in the U.S. The data is from reports that are filed with both the state utility commissions and the U.S. Department of Energy on “FERC Form 1[9].”
Currently the allowed ROE of about 9% constitutes 16 cents of every dollar retail customers pay in the U.S. If we cut that ROE to 6%, the cost to customers drops to 11 cents, a savings of 5 cents or 5%.
The cost of borrowing is about 7 cents of every dollar, which is lower than the cost of equity because debt is cheaper and it finances a smaller portion of the total company (48% vs 52%)[10].
The 5% savings represent an average across all the states, but there is a range as shown in the histogram in Exhibit 2:
Exhibit 2: Histogram of Customer Savings for a 3 Percentage Point ROE Reduction
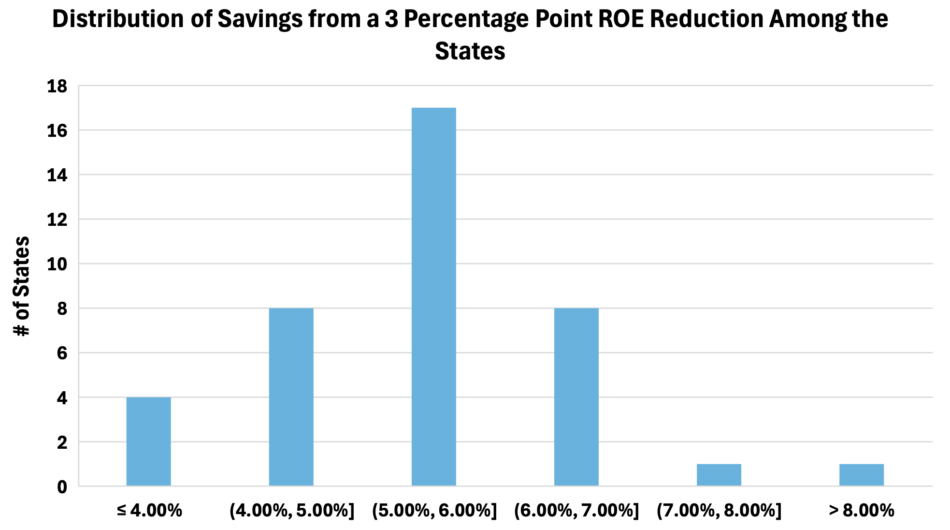
The differences between states are a function of a number of factors including the portion of the company funded by equity versus debt, the actual earned ROE and the portion of costs attributable to capital (which must be financed) versus operating and other costs.
Of course we are not suggesting a reduction in allowed ROEs. Quite the opposite. We think the allowed ROE should vary based on performance of critical outcomes like cost per kilowatt-hour, reliability, safety and emissions. In a cost-plus model the utilities are not, per se, explicitly incentivized to reduce operating costs even though they make up nearly half the bill and virtually all of the costs the utility management can affect. Property and income taxes, interest on debt, maintenance expense and maintenance capital (depreciation) are all out of their control.
How should the states incentivize them to save on operating costs? Here’s one suggestion: allow them to keep half the savings in year 1, 40% in year 2, 30% in year 3 and so on to zero after five years. Of course, this would increase their earned ROE, but both the customers and investors would be rewarded. And when investors are rewarded rather than punished, the cost of financing goes down. Likewise, bad operating cost performance, versus say inflation and peer company performance, should lead to lower allowed ROEs.
States could also give incentives/penalties for reliability, safety and emissions performance relative to decades of benchmark data. This is not a new idea. The industry calls it performance-based ratemaking or PBR. The problem is that PBR in the past has often come with penalties and no rewards and so now PBR is a 4-letter word. But by any other name, providing incentives for better performance would ultimately save customers money as it acts in the same way as competition in non-monopoly businesses.
But more importantly, reducing ROEs based on a theoretical academic model has enormous risks for the states that do it. Reducing – or in our example, eliminating – the equity returns over and above the cost of borrowing for more than half of the financial capital just to save 5% on customer bills ignores two factors that could lead to higher costs in the long run.
First, the market price of the equity would decline, and the cost of borrowing would rise as both the rating agencies and bond market react negatively to the equity capital impairment. One only needs to look at the debt downgrades for the banks because their stock prices declined during the subprime financial crisis to see the linkage between these two dominant sources of financing.
Second, the equity cost of financing would likely be higher than the reduced ROE, eliminating any incentive for investors to provide capital in hopes of a competitive return at a time the industry needs to spend more than $1 trillion over the next 5 years to finance new capacity[11].
This recently happened in Connecticut when the regulator effectively slashed the allowed ROE by disallowing cost recovery for certain investments and expenses. Connecticut represents about one-third of the assets of Eversource, the multi-state utility doing business in New England, and their stock price declined dramatically relative to the average of similar utilities. The decline, in effect, meant the stock market was valuing its Connecticut operations at a P/E multiple of about 4x[12].
That’s an earnings yield of 25%, way above the allowed rate of return for utilities and even higher than the ROE earned by the companies making up the S&P 500. Based on the stock price during that time, shareholders effectively told management not to spend another dime in Connecticut as the allowed ROE was below its cost.
Hey governors, want to add generation and transmission capacity to attract business to your state? Promulgate regulations that make the financing cheaper, not more expensive.
In fact, the whole exercise should not be to award an ROE based on the concept of the “cost of capital”; it should be based on a risk-adjusted comparison of investors’ alternatives like the 18.4% being earned by the companies that make up the S&P 500. Granted, a monopoly utility has less risk than the average S&P 500 company, but if today’s allowed ROE of about 9% was too high, then why do utilities trade at a much lower price-earnings ratio than the S&P 500 even though their growth rate now exceeds the long term average of that index[13]? We will cover this subject in more detail in a future piece as a reprise to our expert testimony before the Federal Energy Regulatory Commission in 2018.
If states are frustrated with lack of cost control on the part of their utilities, they need to reward the utilities that have better cost and performance outcomes rather than punishing them for something that is out of their control, like inflation or market forces for wholesale power costs in the states that have competitive generation. A cost-plus revenue system works better when there are incentives to lower the costs before they are passed along. Taking an axe – or blade – to those expenses will yield far better results than the few percentage points that would result from reducing the ROE. And reducing the ROE will always result in flight of capital as virtually all utilities operate in multiple states and so they and their shareholders always have other places to invest their money. Flight of capital will ultimately cost customers money because it reduces investment that supports system reliability and safety.
If I were a governor that is not a risk I would take.
Disclosure
This piece is not an offer or solicitation with respect to the purchase or sale of any security. Information regarding particular securities is used as examples only and should not be considered a recommendation of that security. This Document is not intended to constitute legal, tax, or accounting advice or investment recommendations and investors and clients are encouraged to consult their own legal, tax or other advisors before investing.
Information provided is believed to be accurate as of the date on the materials. EIP reserves the right to update, modify or change information without notice. The information is based on data obtained from third party publicly available sources that EIP believes to be reliable, but EIP has not independently verified and cannot warrant the accuracy of such information. The presentation contains EIP’s opinion, and such opinions may change at any time without notice. Certain information contained herein may constitute forward-looking statements. Due to various risks and uncertainties, actual events, results or the performance of the strategy may differ materially from those reflected or contemplated in such forward-looking statements.
All investments carry risk, including the risk of loss of investment principal. Additionally, because EIP invests primarily in the securities of companies in the energy industry, portfolios are exposed to additional risks that may not exist for more diversified portfolios. Energy industry companies are sensitive to, among other things, fluctuations in fuel supply and demand, interest rates, seasonal fluctuations, counterparty risk from customers who become financially distressed or unable to perform, special risks of constructing and operating facilities, lack of control over pricing (which can be volatile and subject to wide fluctuations), merger and acquisition activities. They are also exposed to significant political and regulatory risk, including substantial governmental regulation that affects construction, maintenance and operations and the prices and methodology of determining prices that energy companies may charge for their products or services. As a result, a client’s portfolio may experience significant losses during periods in which such factors negatively impact a significant number of energy companies.
[1] EIA, NextEra, corporate reports and EIP estimates.
[2] IBID – The 35 states account for 58% of U.S. demand and the other 15 states account for 42%.
[3] S&P Global FERC Form 1 for each investor-owned utility in the U.S.
[4] Bloomberg
[5] Pennsylvania’s governor, Joshua Shapiro wrote a letter to all the utilities operating in his state stating as much. The letter reflects almost verbatim the work of a consumer advocate making the rounds to the various states seeking expert consulting fees.
[6] EIA
[7] Bloomberg. Weighted average of 32 publicly traded electric utilities.
[8] This is a hypothetical example of a utility and does not represent any one particular utility or group of utilities. The information provided is based on EIP’s experience and analysis, all of which may change at any time. This analysis is not an offer to purchase or sell a particular security. FERC is the Federal Energy Regulatory Commission
[9] S&P Global FERC Form 1 for each investor-owned utility in the U.S.
[10] IBID
[11] EEI Data: Electric Companies to Invest $1.4T to Support Customer, Power Growth, May 27, 2026
[12] Bloomberg, corporate reports and EIP estimates as of March 15, 2023
[13] Source: Bloomberg. Utility P/E is represented by the UTY. Utility growth rates now approach 9% versus a 7% long-term average for the S&P 500