The frustration some have with the pace of the energy transition all comes down to the rate of attrition.
If the newer/cleaner technologies, including subsidies, have a lower TOTAL cost (operating costs plus capital costs) than existing technologies, the newer technologies will prevail, but the pace of transition will be driven by the rate of attrition of the existing technologies. If those existing technologies have, say, a 40-year life, that attrition rate is 2.5% per year (1/40). This dynamic can be observed in the slow rate at which electric vehicles are replacing internal combustion engine vehicles (See EIP’s EV Deep Dive) or heat pumps replacing gas furnaces, even when the new equipment’s share of sales is high.
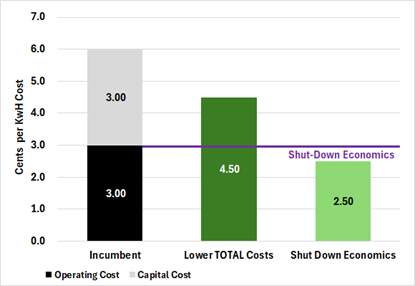
But when the TOTAL cost of a new technology is lower than the OPERATING cost of an existing technology for the same product, the new technology is said to have “shut-down economics” over the old. Exhibit 1 illustrates this simple but powerful construct. The result is that the new technology will be adopted as fast as new units can be built.
Exhibit 1: Hypothetical Example of “Shut-Down Economics”[i]

Source: EIP Estimates
In some regions of the U.S., natural gas fired power generation, utility scale onshore wind and solar – even without subsidies – have a total cost lower than the operating cost of most coal-fired generators.[ii] This is why the decline in coal-fired power generation in the U.S. has been so much faster than the attrition rate.
The usefulness of this concept is obvious to investors, but policy makers should take notice as well. Identifying which technologies are the closest to shut-down economics should drive climate-related policy incentives because the impact of those dollars will be to eliminate carbon emissions sooner. Since it’s the total amount of additional carbon put into the atmosphere over the next 30-40 years that matters, sooner is better.
New energy technologies range from less-carbon to zero-carbon, but their costs and performance vary as well. The “perfect” technology is one that is zero-carbon, is available 24/7/365 and has shut-down economics over incumbent technologies that are more carbon intensive. So far, none of these perfect solutions exist. But there are also “good” technologies (or combinations thereof) that are not zero-carbon but are available 24/7/365 and are closer than many zero-carbon solutions to shut-down economics.
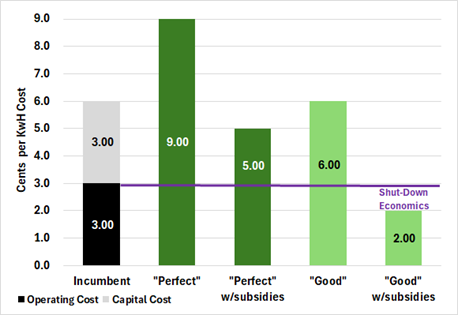
Exhibit 2: “Perfect” vs “Good” Technologies (with and without Subsidies)

Source: EIP Estimates
Let’s run through a simple comparison example illustrated in Exhibit 2. Imagine a zero-carbon technology, (let’s call it the “Perfect” technology) whose total cost is 3-cents more per kilowatt-hour produced (like power generation) or consumed (like a furnace or heat pump) than the incumbent technology. Imagine further that subsidies lower this cost differential from a 3-cent penalty to a 1-cent discount versus the total cost of the incumbent, but still 2-cents more than the incumbent’s operating cost. That subsidy will cause a transition to the “Perfect” technology only as fast as the incumbent machinery wears out and is scrapped. This could easily be 30-40 years.
Now, imagine a situation where that same 4-cents per kilowatt-hour subsidy is applied to a technology that is not zero-carbon but 70% less carbon (let’s call it the “Good” technology) and that 4-cent subsidy lowers the TOTAL cost of the “Good” technology below the OPERATING cost of the incumbent technology resulting in a complete changeover in ten years.
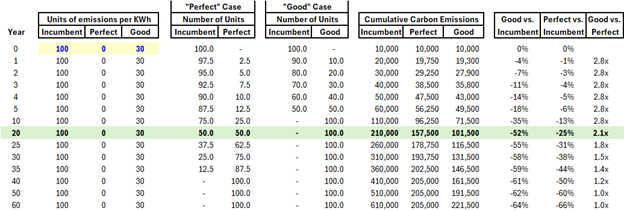
Exhibit 3: “Perfect” vs. “Good” Techonologies – The Impact of Sooner is Better

Source: EIP Estimates
Exhibit 3 shows a simple calculation of the carbon emissions from each scenario[iii]. After 20 years, in this example, the “Good” technology produces 52% less emissions than the incumbent and 2.1x the reduction of the “Perfect.” It would take between 50-60 years before the “Perfect” technology results match the “Good.”
Will we not have new and better technologies in the next 20 years? More opportunities to exploit newly developed low or zero-carbon products with shut-down economics?
This example assumes no demand growth and is overly simplistic, but it illustrates the point that speed of adoption matters as much as the amount of emissions improvement of the new technology. And that the lynchpin of that speed is shut-down economics.
It also illustrates that it is wasteful to subsidize newer/cleaner technologies to any degree in EXCESS of achieving shut-down economics. Once shut-down economics have been achieved, incremental subsidy dollars, if any, should be deployed elsewhere where they can tip that new technology into shut-down economics over incumbents.
From an investor perspective, of course, it’s profitability and growth that matter. For commodity businesses like energy, profitability mostly hinges on cost competitiveness. And that matters whether the energy production/conversion/consumption machinery is old technology or new. Growth largely hinges on adoption and as this example shows there is a step-change in the adoption rate once shut-down economics are achieved.
In this and many other regards, policy and investment success have a lot in common and practitioners of each should heed the old adage:
Don’t make perfect the enemy of the good.
This information presented contains EIP’s opinion which may change at any time and without notice. The information provided above is based on data obtained from third party publicly available sources that EIP believes to be reliable, but EIP has not independently verified and cannot warrant the accuracy of such information. In providing the information, EIP has made several assumptions that if changed, materially affect the information and conclusions provided. Nothing in this article is an offer to sell or buy a particular company or invest or refrain from investing in a particular industry.
[i] Exhibit 1 is solely for illustration of EIP’s view of how “shut down economics” works and does not show the actual experience of any particular industry or company. Nor does it show any EIP’s experience with “shut down economics.
[ii] Source: Lazard’s Levelized Cost of Electricity Analysis – Version 16.0, comparing the Fixed & Variable O&M + Fuel Cost components of Lazard’s low-end and high-end LCOE estimates.
[iii] EIP assumptions include “Units of emissions per KWh” indexed to 100 for the “Incumbent” technology with a 100% reduction for the “Perfect Technology” and 70% reduction for the “Good” technology. The information provided is based upon those assumptions listed above as well as others that if changed would have a material impact on the information provided.