What Happened to the Energy Transition?
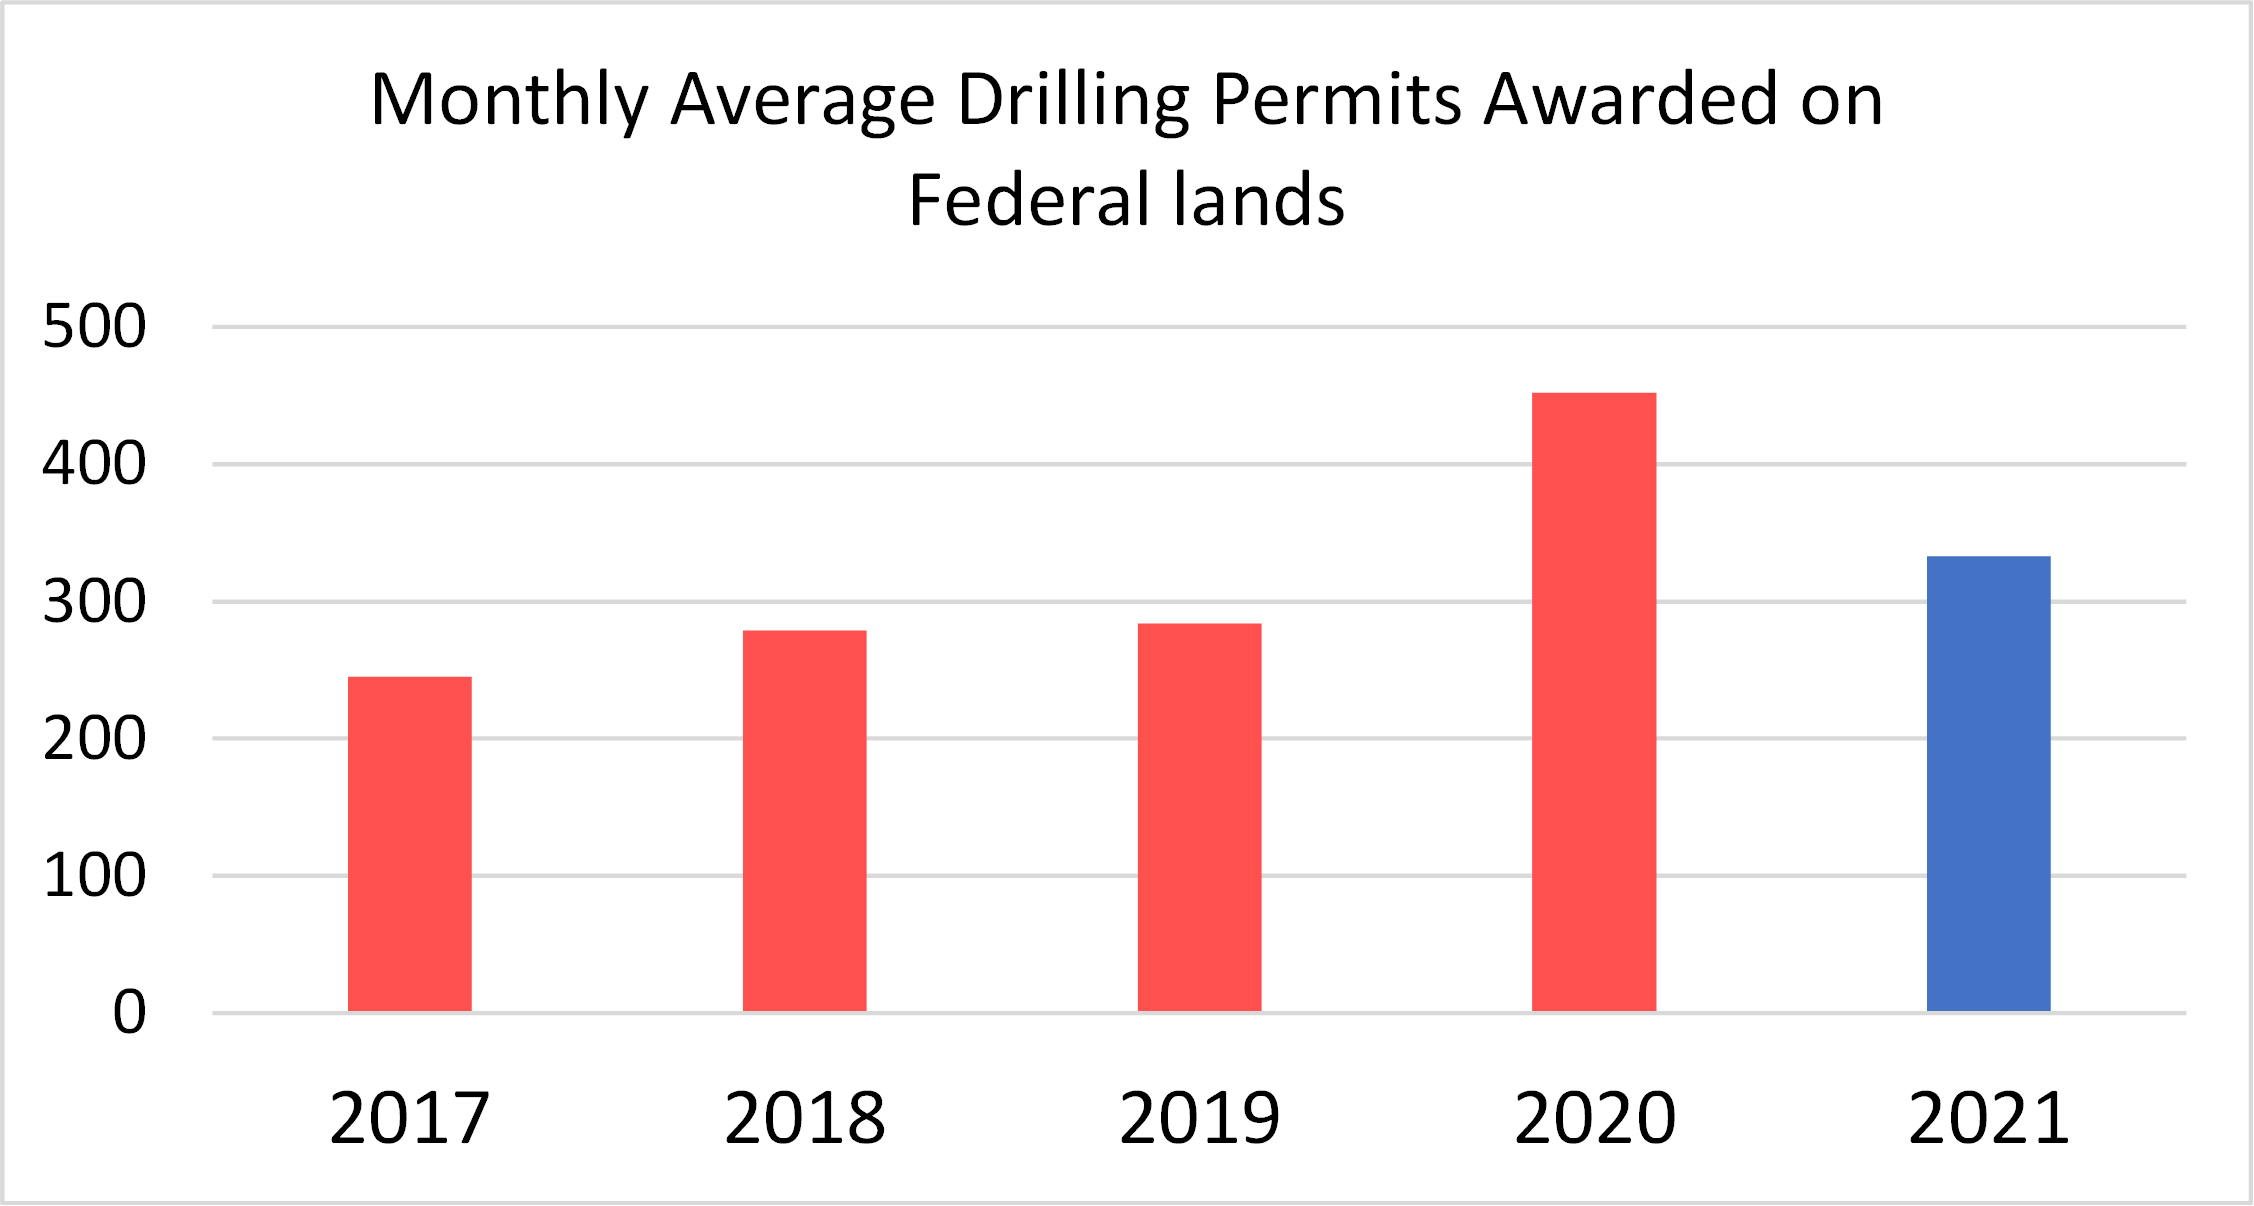
The past year saw a froth of excitement about “clean” energy stocks following the election melt into the reality of an energy system that is still heavily dependent on – and not getting enough supply of – fossil fuels. West Virginia Senator Joe Manchin just stiff-armed the Build Back Better (BBB) bill loaded with clean energy incentives less than a week after the Energy Secretary asked the energy industry to drill, baby, drill. Joe Biden’s administration is now quick to point out that they have issued drilling permits on federal lands at a faster pace than the prior administration, see Exhibit 1. As they say, what a difference a year makes!
Exhibit 1: Monthly Drilling Permits on Federal Land

Source: Public Interest via Washington Post
The recent price spikes in fossil fuels have been related to random supply and demand events (weather affecting renewable production and demand, operating snafus, etc.) which could easily correct in the other direction, but they served as a reminder that, as Roger Pielke, Jr. said in his book The Climate Fix “..when policies focused on economic growth confront policies focused on emissions reductions, it is economic growth that will win out every time.”
For investors, as well as policy makers, it’s a reminder that the energy system is enormously complex, interconnected and run almost entirely by private companies seeking a return on their investment — or as Senator Warren refers to them, “greedy corporations.” As such, successful policies are those that harness the profit motive, the innovation engine (both public and private) and the public’s desire to buy products that are cheaper and perform better than the ones they replace.
The bipartisan Infrastructure Investment and Jobs Act, signed into law in November, got the votes of 69 senators because it is an all-of-the-above approach focused on driving down costs with innovation. It added incentives for carbon capture and nuclear power not just renewables. The Build Back Better bill – now in limbo – aims to reinforce those initiatives with larger monetary incentives. Everyone is for a cheaper, cleaner, safer, and more reliable energy system. Almost no one is for a more expensive one.
Investors have taken notice, as shown in the graphs below. The first is the relative performance of the PHLX Utility Sector Index (UTY) versus the iShares Global Clean Energy ETF (ICLN) that tracks the S&P Global Clean Energy Index. The second is the Energy Select Sector SPDR Fund (XLE), the ETF that tracks the S&P 500 Energy Sector, versus ICLN.
Exhibit 2: Utility Relative Performance (UTY) vs ICLN

Source: Bloomberg
Exhibit 3: Energy Relative Performance (XLE) vs ICLN

Source: Bloomberg
The beginning date of these graphs is 4 months before last year’s presidential election when investors began pouring into the clean energy stocks in anticipation of a Biden victory. Investors got the election victory but did not necessarily get a follow through on clean energy corporate earnings.
By our measure, 25% of the positions in ICLN have negative expected earnings for 2021. And while consensus expectations for ICLN earnings growth for 2022 is 28%, analysts also thought that about 2021 growth vs 2020, but it didn’t happen. At the beginning of this year, consensus estimates for ICLN’s 2021 earnings indicated a 35% growth rate over 2020, but it now looks like it will be only about 10%. Said another way, earnings expectations for 2021 are now 18% lower than they were just 12 months ago. (source: Factset, Bloomberg) But wait, it gets worse.
ICLN holds two different kinds of companies: utilities and renewable developers on the one hand and “clean energy” manufacturers of batteries, fuel cells, wind turbines and solar panels on the other. The first group makes up about 46% of ICLN’s market cap but generates 70% of ICLN’s earnings. This first group has a weighted average P/E of about 25x. The second group has a P/E of over 69x and accounts for over 72% of those downward earnings revisions for 2021. (Source: Factset, Bloomberg). All of these negative earnings adjustments happened before Senator Joe Manchin nixed the BBB bill in the Senate. Who can blame investors for reducing their holdings of expensive stocks with declining earnings expectations and negative price momentum?
This is not to say that those companies won’t succeed in the future; many investors still believe that these supply-end energy producers will be profitable someday and disrupt the incumbent utilities. But since the utilities own the poles and the wires that move the electricity and furthermore grow their earnings by investing new capital to connect to newer, cleaner and cheaper forms of supply, we believe that the disruption narrative is off base when it comes to infrastructure. The disruption is being done to the older, dirtier and more expensive sources of energy supply.
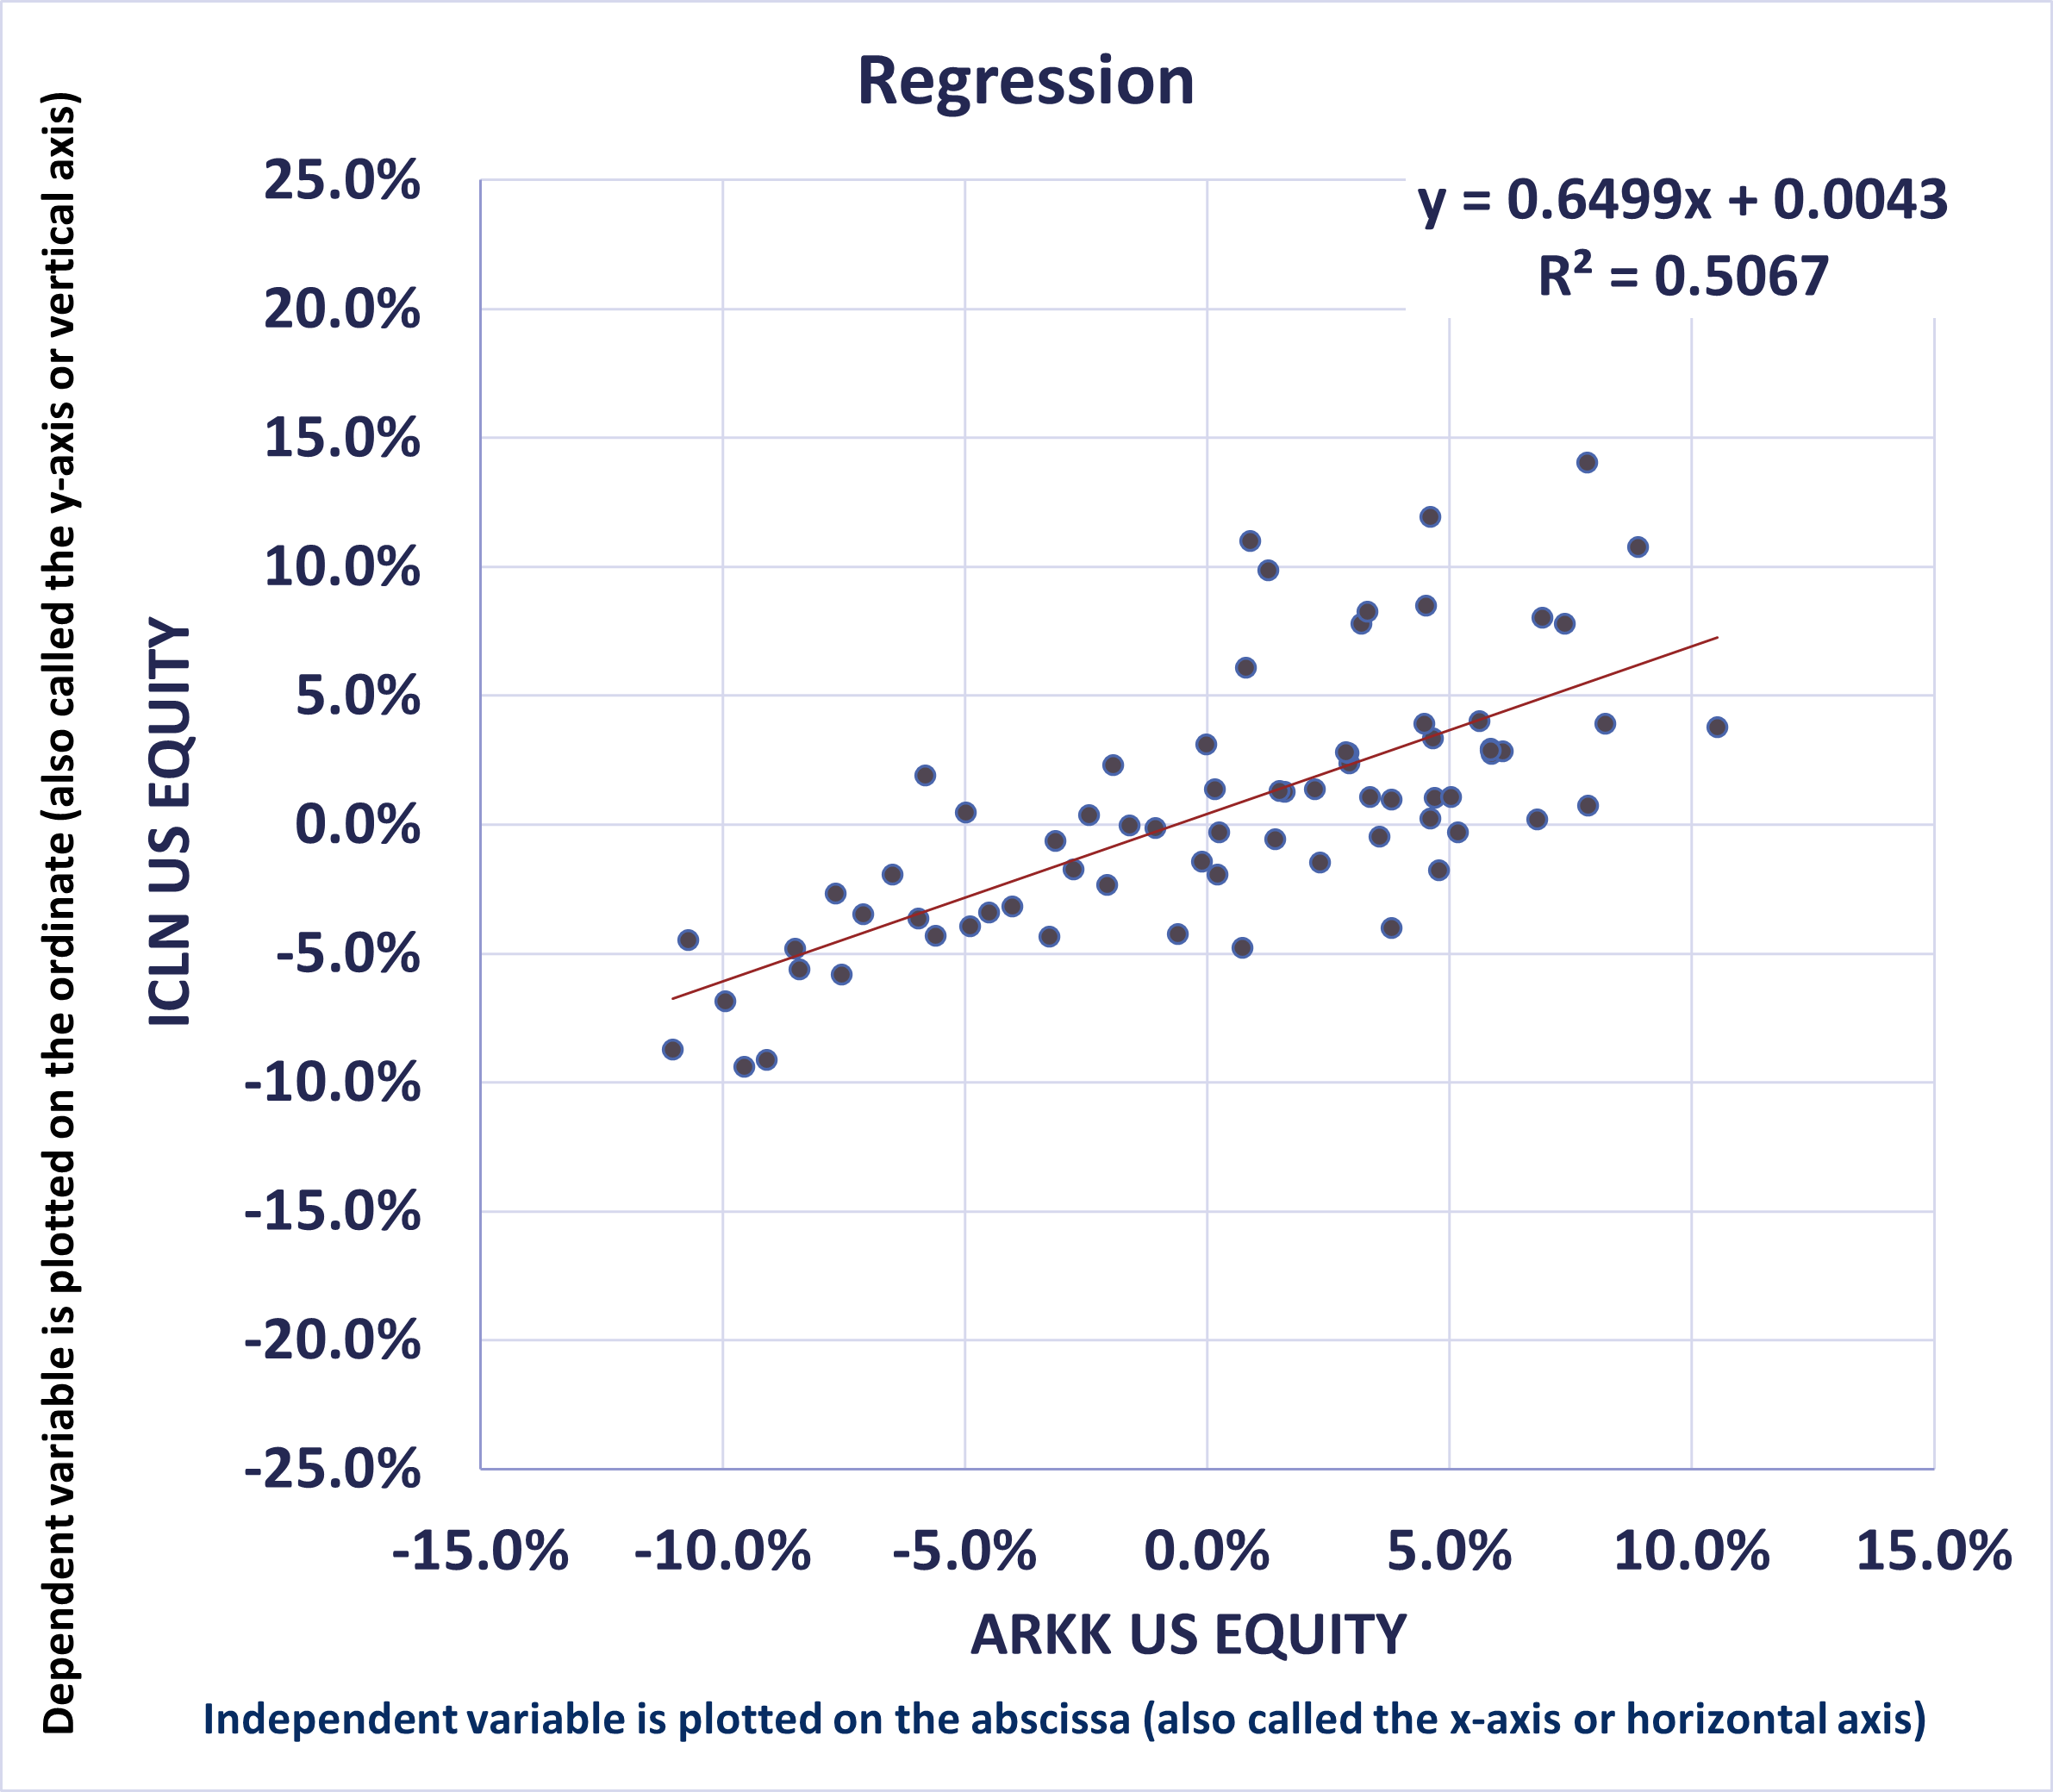
Disruption brings us to the last set of graphs. The first compares the performance of ICLN with Cathie Wood’s ARK Innovation ETF (ARKK) from that same start date 4 months before the election. While not 100%, the correlation is high.
Exhibit 4: Correlation of ICLN with ARKK

Source: Bloomberg
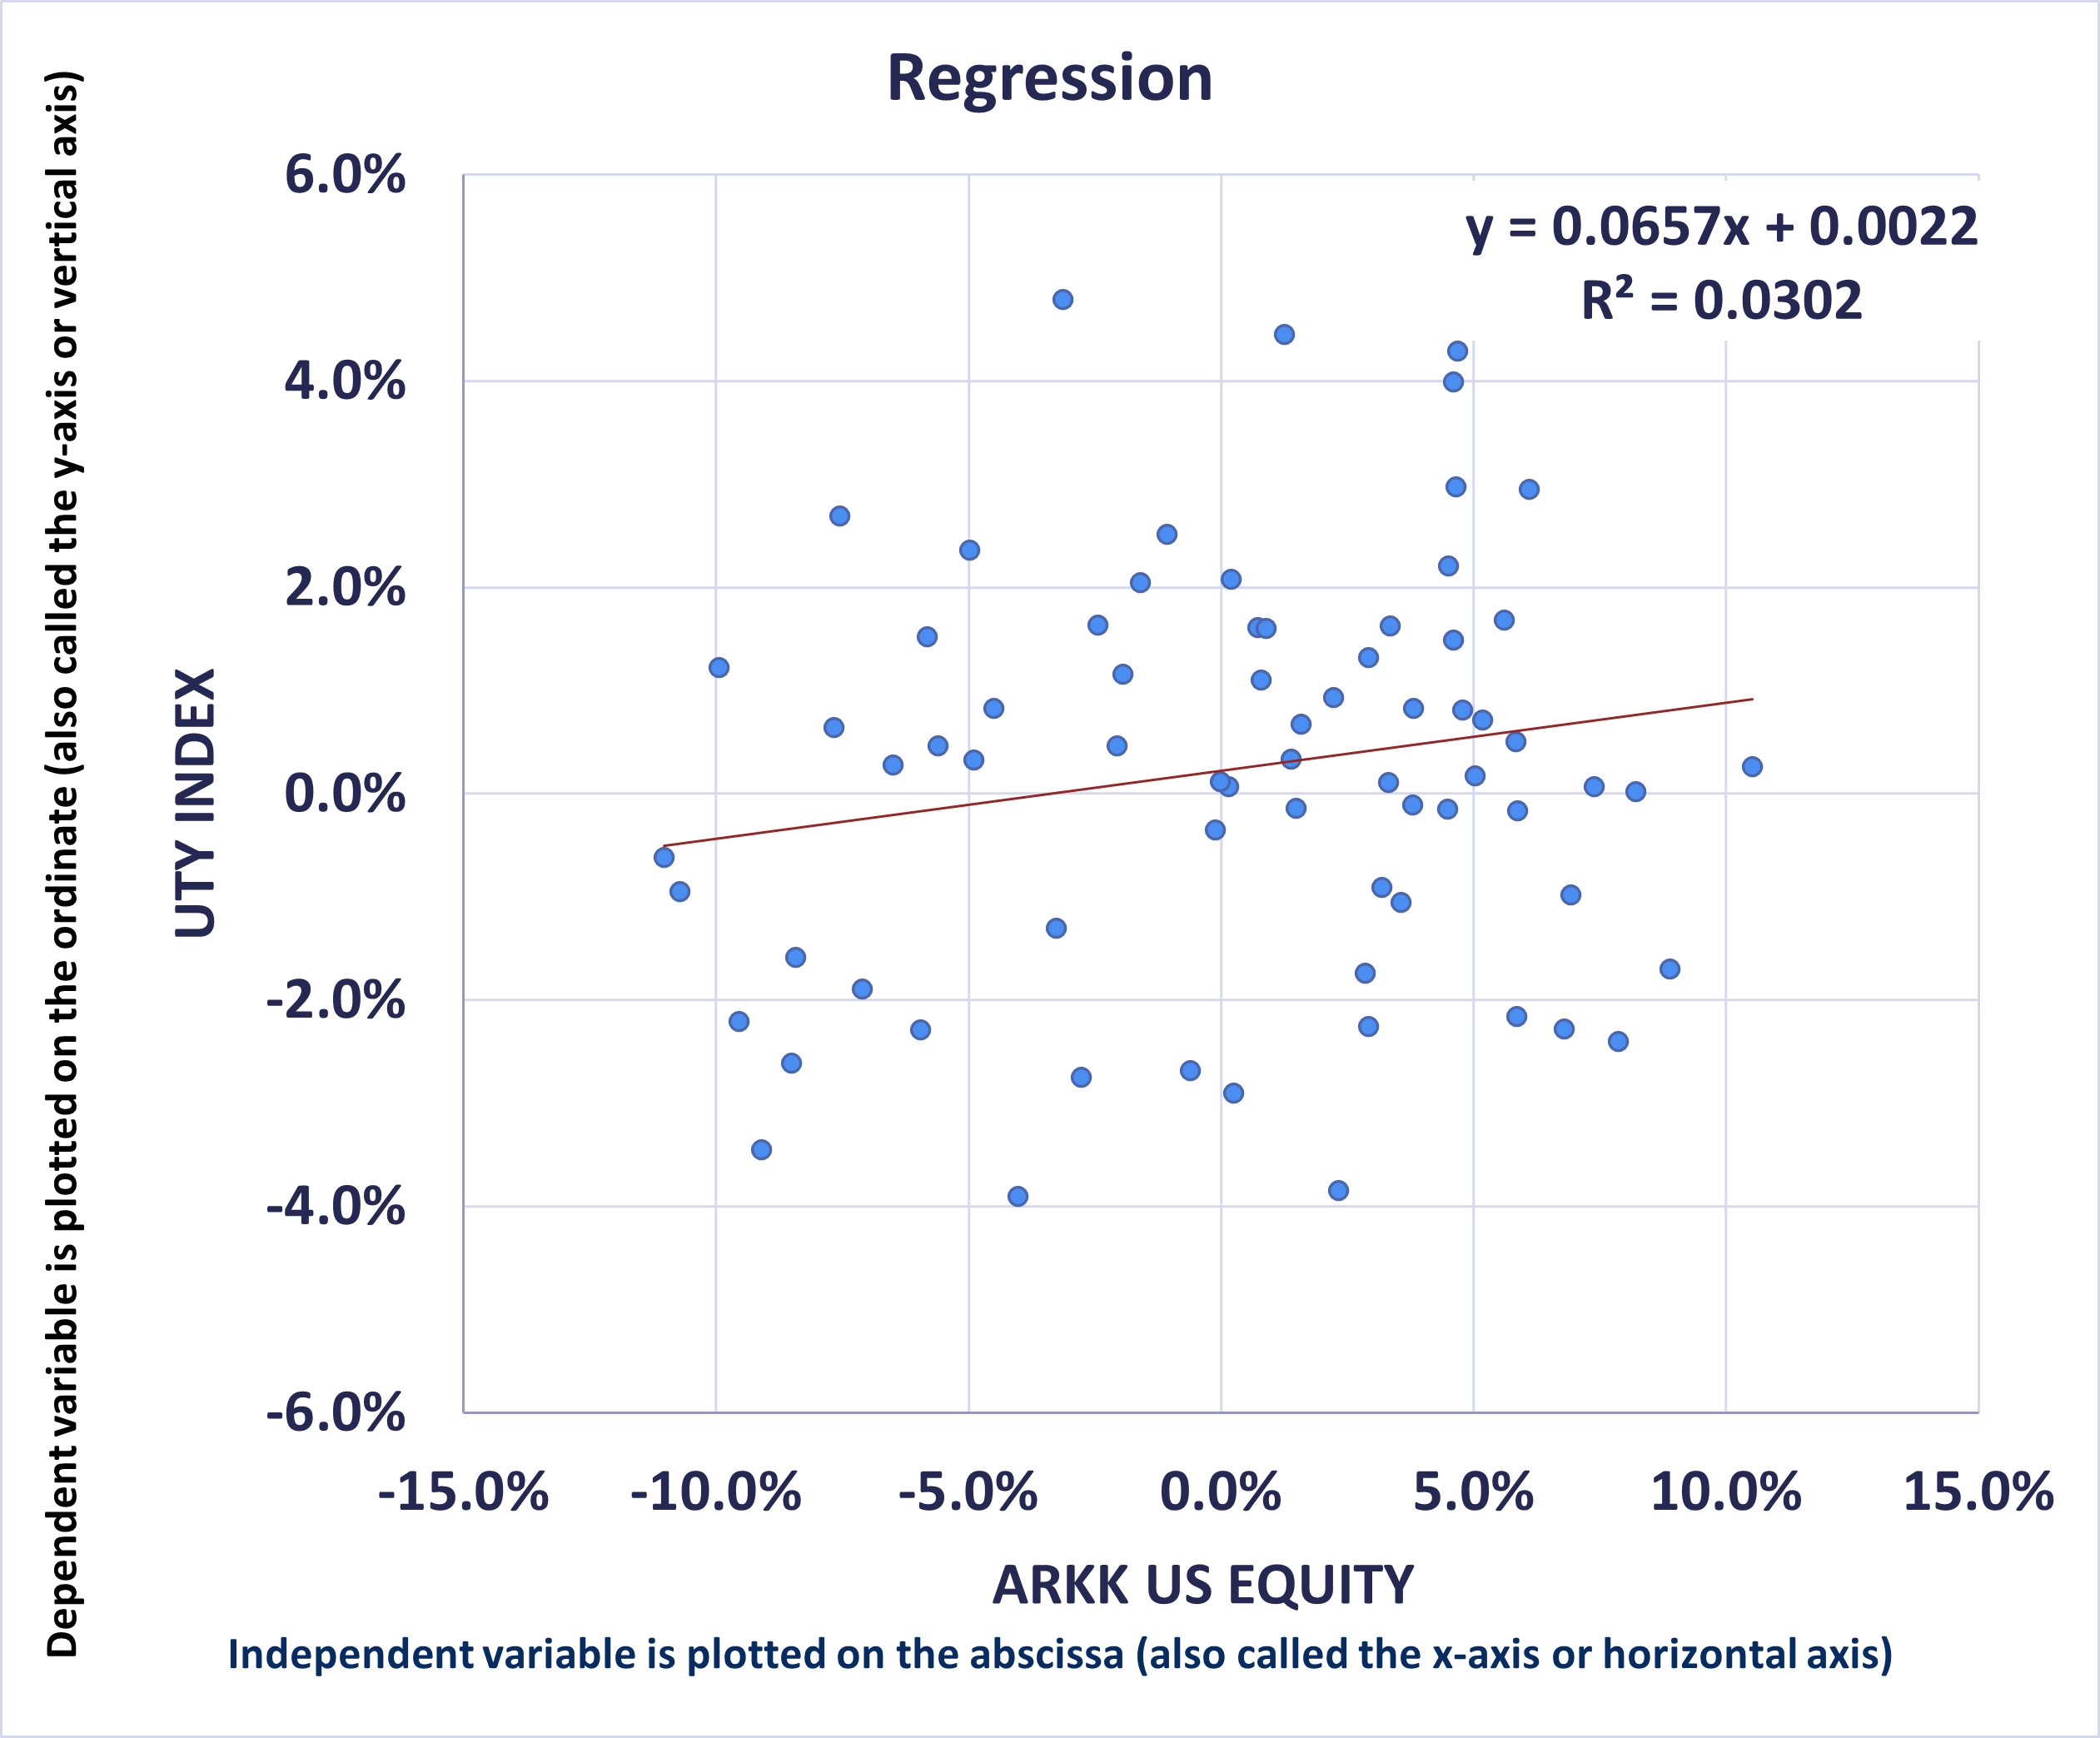
Not so for the UTY, which has virtually no correlation to ARKK and is therefore diversifying to anyone who has a portfolio that has benefitted from the positive – but now waning – sentiment for “disruption” stocks.
Exhibit 5: Non-Correlation of UTY with ARKK

Source: Bloomberg
All this is a reminder that the “Energy Transition” continues to, well, transition. The products and services that will win out are those that lower the cost of and improve the performance of the energy system. Those performance characteristics are primarily reliability/resilience, safety, and environmental impact. It is also a reminder that, for investors at least, it matters what valuation the providers of these products and services can be purchased for.
Few events speak to this more loudly than Third Point’s recent third quarter letter outlining its proposal to split Royal Dutch Shell into two parts: its clean LNG/Renewables/marketing businesses on the one hand and its legacy oil and gas production/refining/ chemicals businesses on the other. Third Point believes that Shell’s clean energy businesses that make up only 40% of EBITDA support its entire valuation today implying that investors are currently getting the legacy businesses for free.
From our perspective, Shell is a technology leader that can bring the gigaton scale solutions that will be required for the world to decarbonize. While not necessarily a leader in solar, wind or batteries, Shell’s process technology and infrastructure have plenty to offer in areas such as carbon capture, hydrogen, ammonia as a fuel, transportation, etc. All of these have good profit potential and come at fire-sale valuations while they are buried inside an energy conglomerate.
What History Can Teach US
The U.S. has had some big wins over the last 15 years in lowering the cost of cleaner forms of energy, such as shale drilling technology which was supported for years by tax incentives and government sponsored R&D until it was profitable. Those innovations slashed costs, giving natural gas a much larger share of power generation, as it backs up intermittent renewables and drives out dirtier coal plants.
The roughly 90% drop in the cost of wind, solar and batteries [i] (in the past ten years) is another big win which benefitted enormously from state-level mandates and federal tax incentives.
And let’s not forget about the rapid adoption of LED lighting which uses about 75% less power than conventional lighting[ii] and has saved US consumers billions. Widespread LED adoption, which drove down costs was, in turn, driven by a 25% efficiency improvement mandate in the 2007 Energy Independence and Security Act signed into law by Bush 43. To paraphrase Michael Jordan, Republicans buy electricity too.
The rancorous political debates that brought about these all-of-the-above successes still rage on today. Let’s hope it never stops.
Here’s wishing everyone a great holiday season and a safer, healthier, cleaner and more resilient new year!
Best regards,
James J. Murchie
[i] Based on Lazard’s Levelized Cost of Energy Analysis -Version 15.0 dated October 2021 and EIP’s analysis using the Lazard analysis. The Analysis is based upon numerous assumptions that if changed could affect the discussion above.
[ii] US Dept of Energy.
UTY Index (UTY): The PHLX Utility Sector Index (UTY) is a market capitalization-weighted index composed of geographically diverse public utility stocks.
iShares Global Clean Energy (ICLN) ETF is an exchange-traded fund incorporated in the USA. The ETF tracks the performance of the S&P Global Clean Energy Index. The ETF holds energy, industrial, technology, and utilities stocks that can be predominantly classified as mid cap. The ETF weights these holdings using a market capitalization methodology.
Standard & Poor’s Global Clean Energy Index (SPGTCED) provides liquid and tradable exposure to 30 companies from around the world that are involved in clean energy related businesses. The index is a modified market cap weighted mix of Clean Energy Production and Clean Energy Technology and Equipment Providers companies.
Standard and Poor’s 500 Energy Index (S5ENRS) is a capitalization-weighted index. The index was developed with a base level of 10 for the 1941-43 base period. The parent index is SPXL1. This is a GICS Level 1 Sector group. Intraday values are calculated by Bloomberg and not supported by S&P DJI, however the close price in HP<GO> is the official close price calculated by S&P DJI.
Energy Select Sector SPDR Fund (XLE) is an exchange- traded fund incorporated in the USA. The ETF tracks the performance of the Energy Select Sector Index. The ETF holds large-cap U.S. energy stocks. It invests in companies that develop & produce crude oil & natural gas, provide drilling and other energy related services. The holdings are weighted by market capitalization.
ARK Innovation ETF (ARKK) ARKK invests in equity securities, is an actively managed exchange-traded fund incorporated in the USA. ARKK invests in equity securities of companies relevant to the theme of disruptive innovation. Relevant themes are those that rely on or benefit from the development of new products or services in scientific research relating to Genomics Revolution, Web x.0, and Industrial Innovation.
The indices have not been selected to represent an appropriate benchmark with which to compare an investor’s performance, but rather are disclosed to allow for comparison of the investor’s performance to that of certain well-known and widely recognized indices. An index is unmanaged, does not incur fees or expenses and an investment cannot be made directly in an Index.
The above is Energy Income Partner LLC’s (EIP) opinion, and such opinions may change without notice or duty to update. The information is based on data obtained from third party publicly available sources that EIP believes to be reliable, but EIP has not independently verified and cannot warrant the accuracy of such information. Discussion relating to third party funds is provided solely for informational purposes only. The information provided above is not an offer to purchase or sell or a solicitation to purchase or sell a particular security or groups of securities. There is no guarantee that any securities held, or sectors represented in, any fund/account managed by EIP will not overlap with those third-party funds or indices. Discussions regarding specific companies are for illustrative purposes only and should not be considered as representative of any portfolio or portfolio holding contained in accounts or funds managed by Energy Income Partners, LLC nor should it be construed as a recommendation or an offer to purchase or sell or solicitation of a purchase or sale of a particular security.
