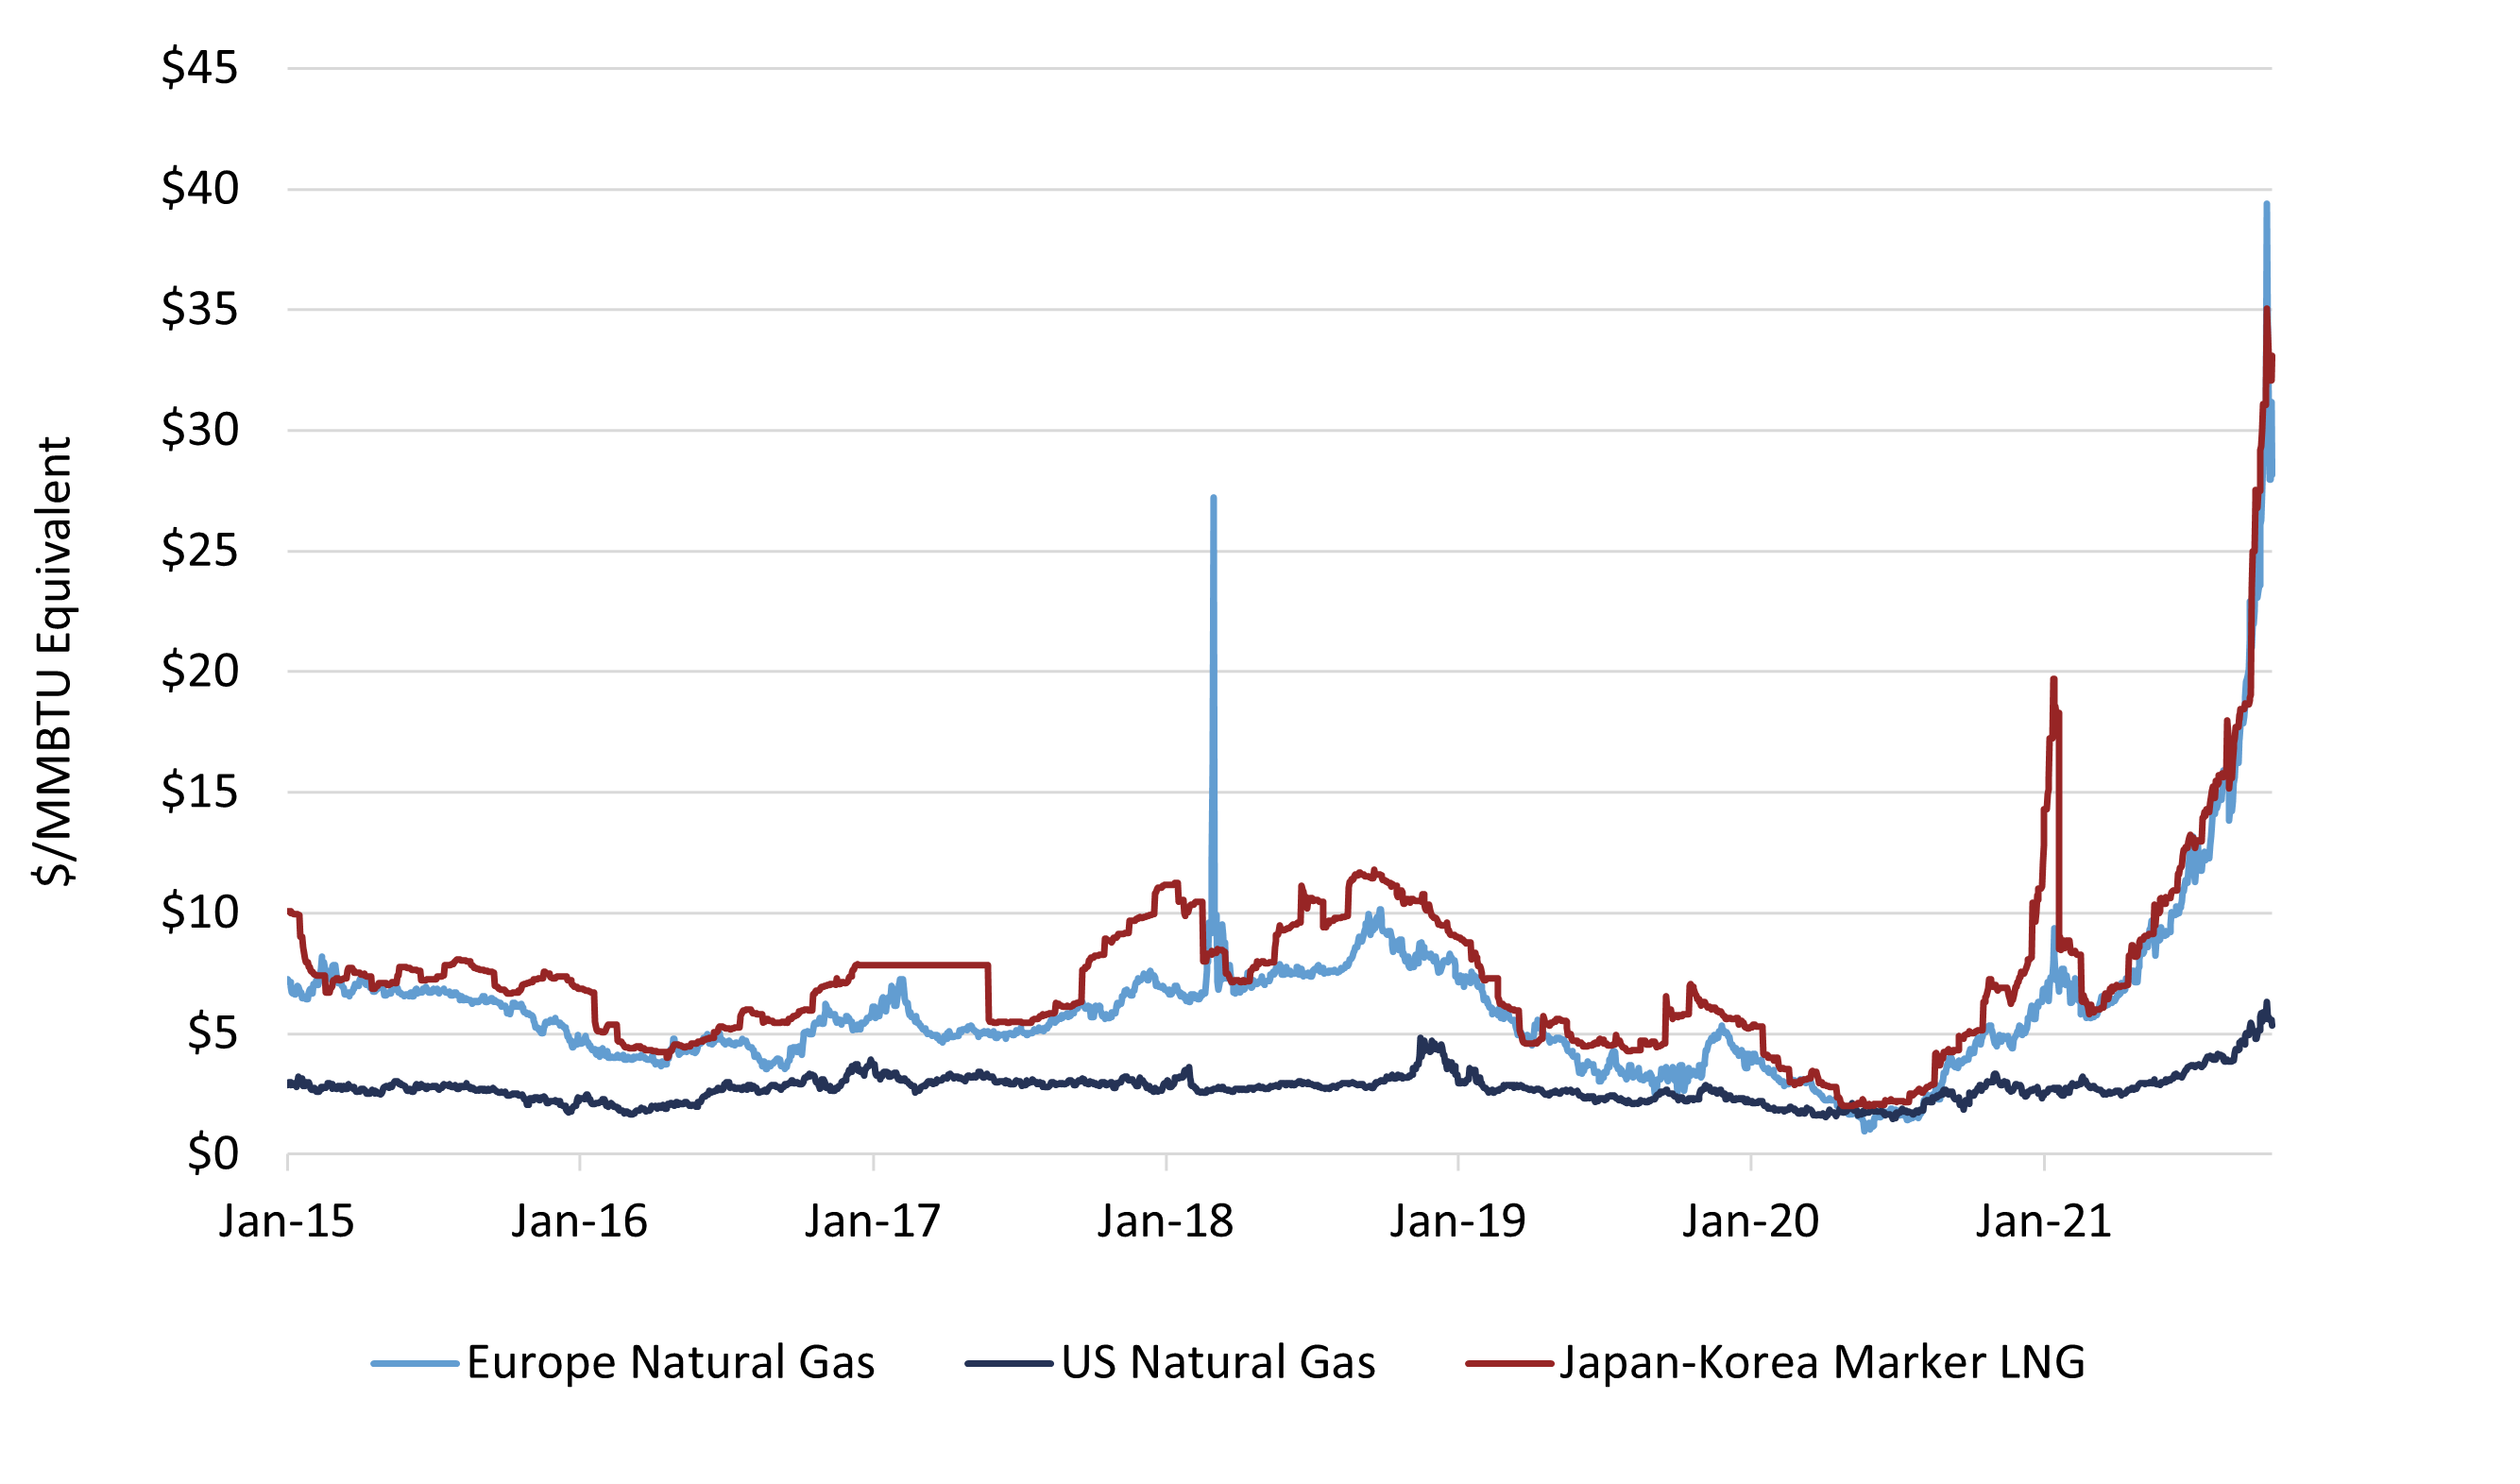
There’s been a lot of media attention lately on the current global shortage of natural gas and steep price increases that have come with it. The runup in U.S. and European natural gas prices is, of course, driven by supply and demand – simply put, there’s too much demand, and not enough supply.
Exhibit 1 – U.S. and European Natural Gas Price 2015-2021

Source: Bloomberg, EIP.
While some of the factors behind this imbalance are transitory, such as the impact of weather on demand and wind and solar production, others, like the ability for new supplies to close the gap, may take more time to correct.
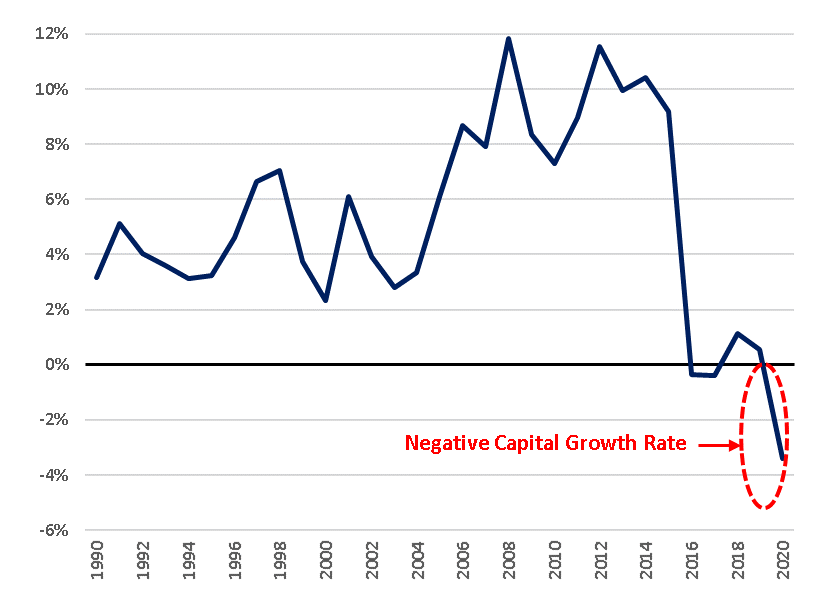
Capital spending by the oil and gas industry is at a three-decade low and now sits below levels needed to offset depletion (the natural decline of existing production) as shown in the following graph:
Exhibit 2 – Capital Growth Rate of Large Publicly Traded Oil and Gas Producers

Source: FactSet, Bloomberg, EIP Estimates.
This graph shows the capital growth rate of the publicly traded oil and gas companies (including the international majors like BP, Shell and Total). The capital growth rate is calculated by subtracting depreciation, depletion and amortization (DD&A) from capital spending and dividing the result by the asset base (property, plant and equipment or PP&E). When this number is negative these companies are shrinking their capital base.
We believe that this low capital spending is in response to angry shareholders who watched hundreds of billions of their dollars drilled into the ground never to return as profits. But it’s also likely a response to ESG investors (specifically those who prefer engagement over divestment) who aim to shrink oil and gas sector capitalization to align with the sunsetting of fossil fuels. To quote the chairman and CEO of Chevron: “There are two signals I’m looking for [to increase capital spending] and I’m only seeing one of them right now. We could afford to invest more. The equity market is not sending a signal that says they think we ought to be doing that.”[1] In simpler terms, he’s probably worried that activist investors will come along and shake up his board the way that Engine No.1 rattled ExxonMobil’s cage in May of this year after winning a contentious battle for three new board seats.
We would suggest the “signal” that matters is whether capital spent earns an attractive risk-adjusted return. That’s what makes an investment “affordable” and satisfies shareholders that capital is being reinvested responsibly.
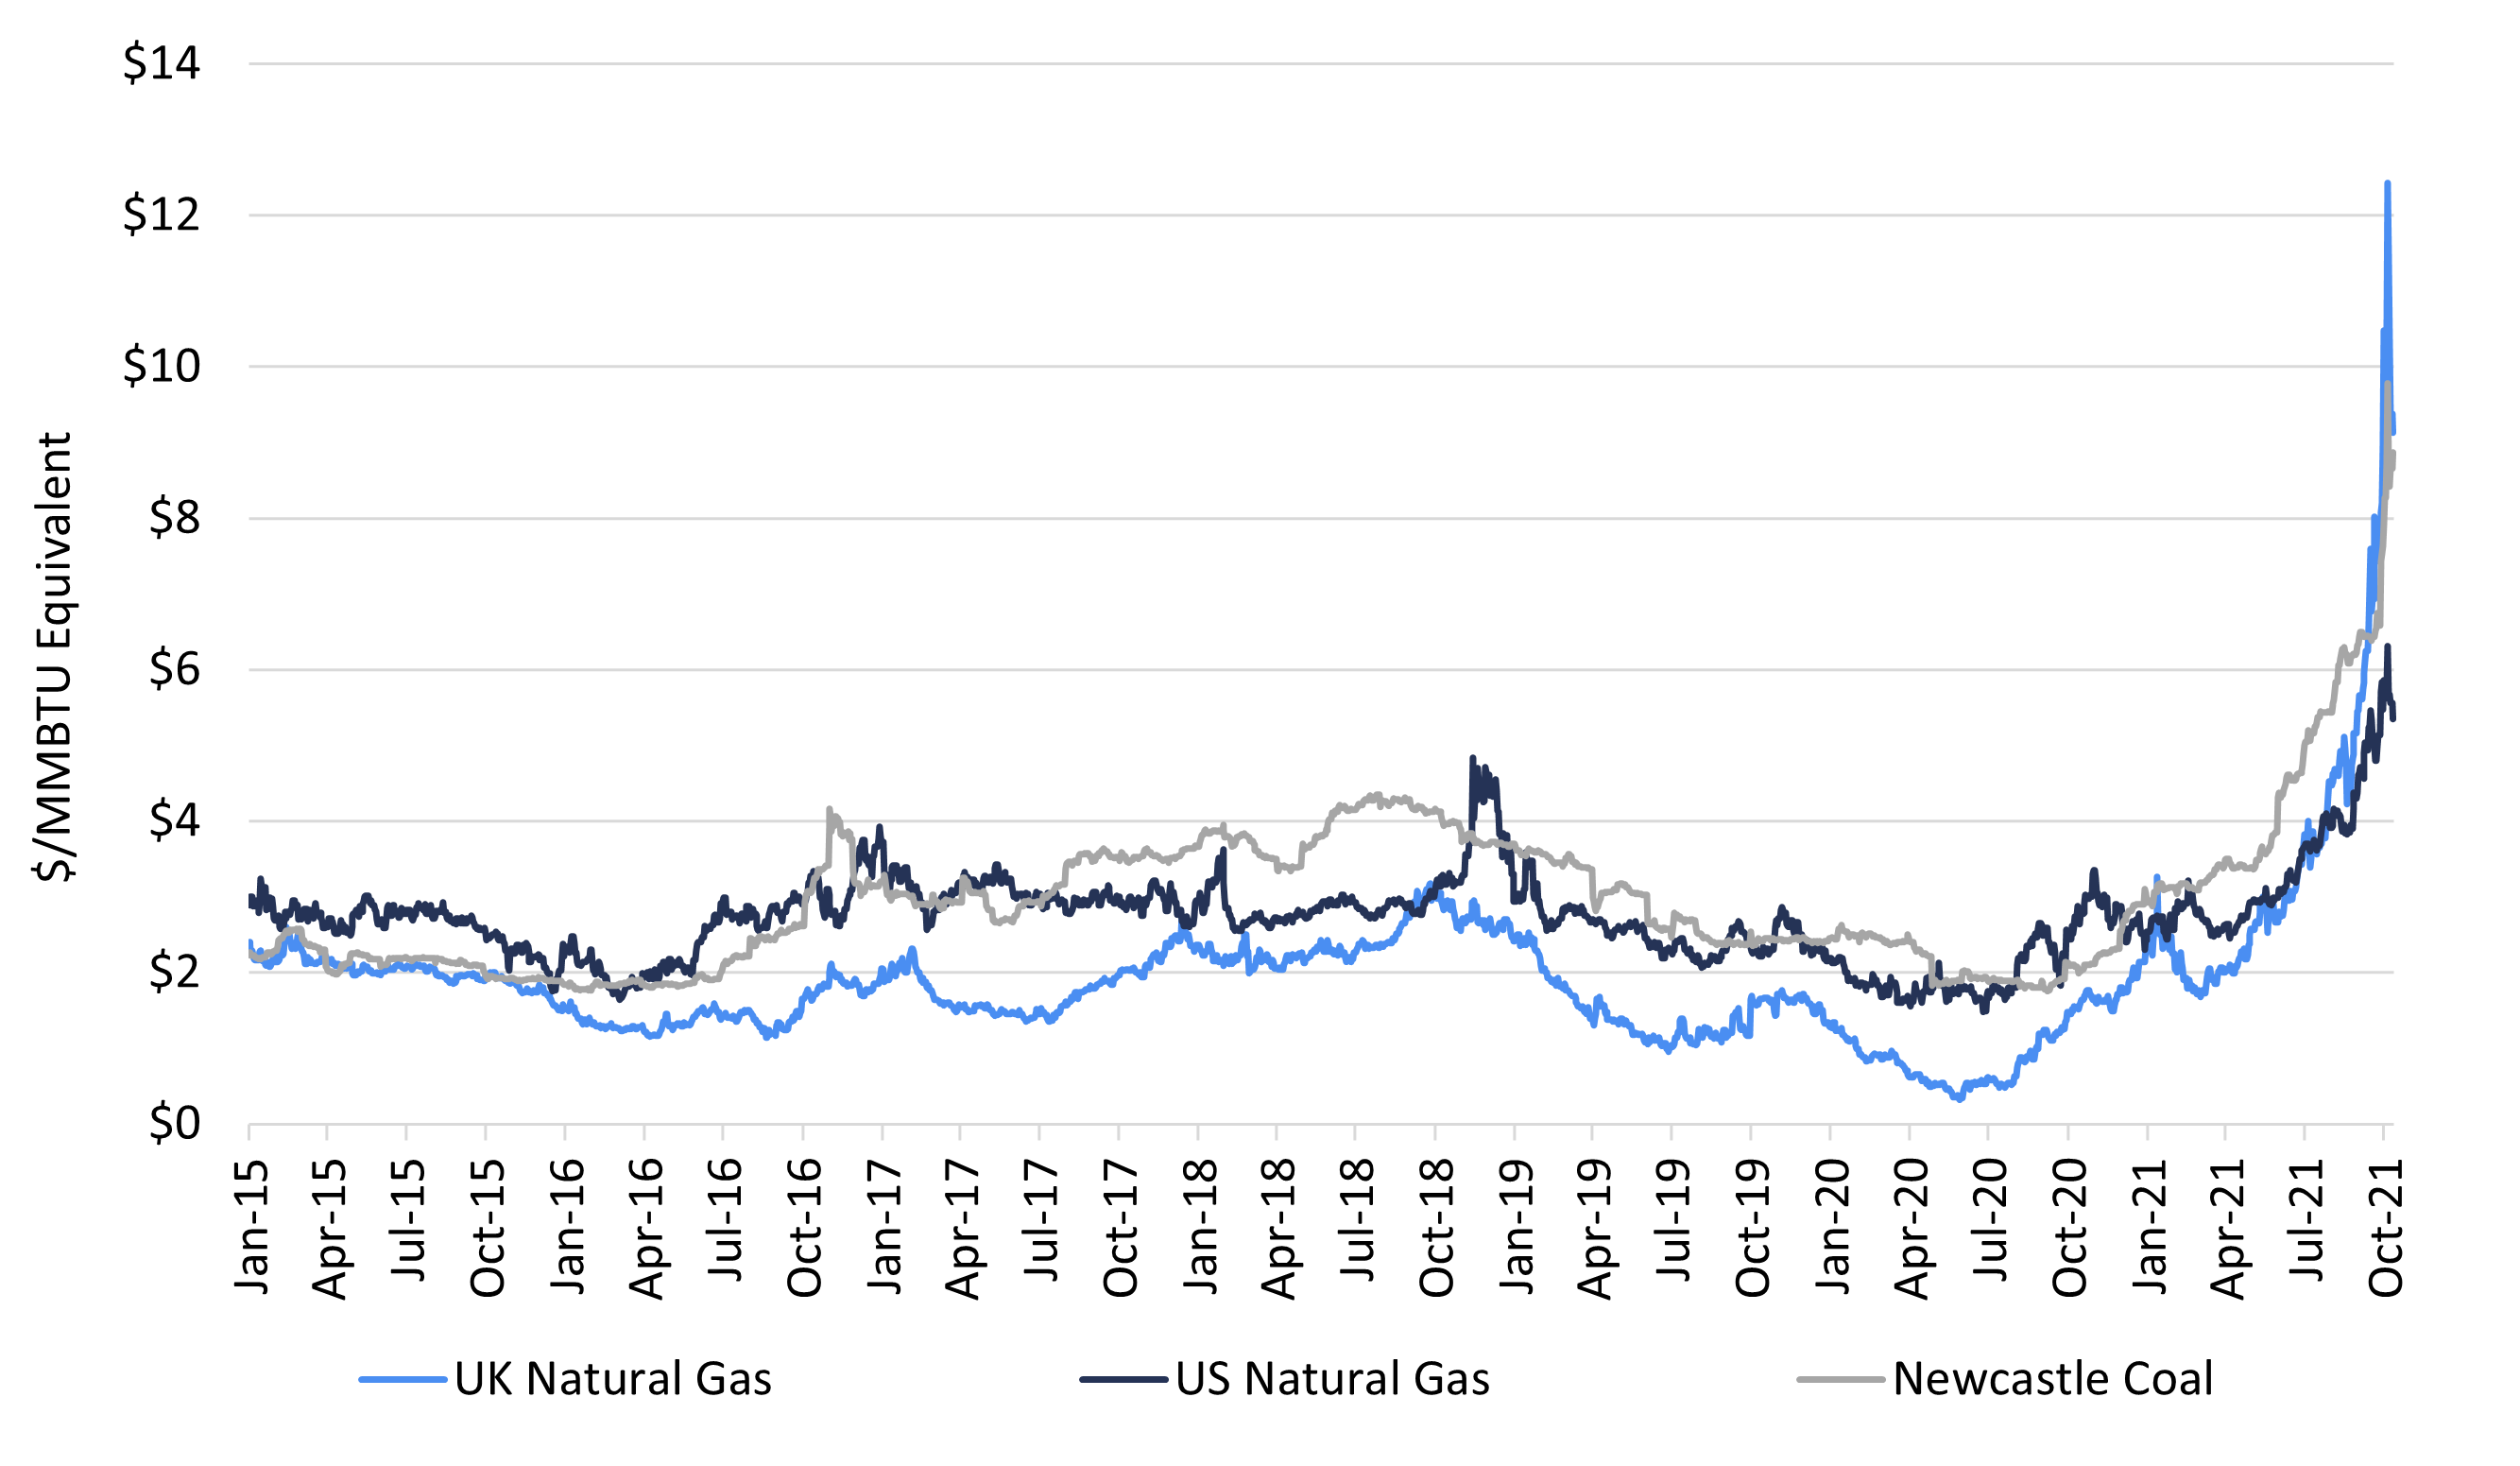
If the cavalry isn’t coming to the rescue on the supply side, how about the demand side? Well, the first thing that happens when the price of one energy source rises, is a switch to other cheaper sources. Cars and trucks may have no fuel alternative in the short term, but the power grid does, and it’s recently been turning back to coal-fired electric generation, leading coal prices to spike alongside natural gas prices.
Table 3 – U.S. and U.K. Natural Gas Prices vs. Coal Price 2015-2021

Source: Bloomberg, EIP.
The second inevitable demand response is someone wailing for government intervention. U.S. natural gas prices are now somewhat globally linked as the U.S. sends about 12%[2] of production overseas in the form of exported liquefied natural gas (LNG). So, from K Street, here come the Industrial Energy Consumers of America (IECA) calling on the Biden Administration to immediately curtail U.S. LNG exports[3] in a letter that deftly weaves the words “inflationary”, “competitiveness”, “jobs”, and “growth” into one sentence (no mean literary feat). This industry association represents chemical producers, steel manufacturers, pharmaceutical companies and paper and forest product companies, all of whom consume cheap domestic natural gas and profit from exporting their products into global markets.
This is where corporate America’s pro-free-market, less-regulation-and-interference-from-Washington narrative starts to crack. While the Secretary of Energy expressed sympathy to the LNG request, we’d call their bluff by demanding that IECA members commit to limiting exports of their products, many of which pose other supply chain challenges. What could be more patriotic than keeping all U.S. industrial production here at home to grow supplies relative to demand and drive lower prices for the beleaguered American Consumer?
We doubt that the Biden Administration would be so careless as to threaten its bipartisan all-of-the-above approach to clean energy by alienating natural gas producing states, like Joe Manchin’s West Virginia, by limiting LNG exports. Oh, and what about our natural gas exports to Mexico and Canada via pipeline; should we cut those off as well?
The full replacement cost of natural gas in the Lower-48 (the price needed to cover operating costs plus a return on investment for new supplies) is comfortably below the current price range of $5-6 per thousand cubic feet (Mcf). Many industry estimates have placed the replacement cost for natural gas in the U.S. at about $2.50 to $3.50 per Mcf.[4] But unless shareholders change their tune and provide Chevron’s second signal to invest, prices could stay above replacement cost for an uncomfortably long period.
As investors in energy infrastructure, the earnings of our portfolio companies are generally not materially affected by these market dynamics. But we often get inbound questions about the world of energy because of our experience and expertise across a wide range of issues. We also think as members of the greater investment community, we should call out counterproductive policies whether they are advocated by legislators, regulators, companies or their industry associations.
[1] Bloomberg Interview on September 16, 2021. https://www.bloomberg.com/news/videos/2021-09-16/full-digital-chevron-chairman-ceo-mike-wirth-warns-on-high-energy-prices-and-supply-crunches-video
[2] EIP calculated LNG demand of 12.6 Bcf per day based upon current LNG export capacity of 11.5 Bcf per day, grossed up by 9% for plant fuel needed to chill and liquify. U.S. Natural Gas Marketed Production was 103 Bcf per day in July 2021, according to the U.S. EIA.
[3] https://www.ieca-us.com/wp-content/uploads/09.17.21_LNG-Letter-to-Secretary-Granholm-2.pdf
[4] This range is based on research reports from Scotiabank (2021), Citi (2018), and Enterprise Products Partners (2016) and is consistent with the average forward price curve for natural gas over the last five years.
The above is Energy Income Partner LLC’s (EIP) opinion and such opinions may change without notice or duty to update. The information is based on data obtained from third party publicly available sources that EIP believes to be reliable, but EIP has not independently verified and cannot warrant the accuracy of such information. References to a particular company or funds are for informational purposes only and are not an offer to purchase or sell or a solicitation to purchase or sell a particular security, company or fund.