Energy MLP Income Fund, LP
2Q 2016 Letter to Investors
Performance
The Energy MLP Income Fund, LP (“EMIF”) was up 3.86% (net of fees) this quarter.1 This compares to the Alerian MLP Total Return Index (”AMZX”) which was down 4.17% this quarter and Wells Fargo Midstream MLP Total Return Index (“WCHWMIDT”) which was down 5.99% this quarter. Besides the decline in crude oil prices, I think a lot of the negative performance for MLP indices in the first six weeks of 2016 can be linked to the pending merger between Energy Transfer and Williams, two of the larger midstream companies in the US. Energy Transfer had to add a $6 billion cash component to its offer to get the Williams board to agree to the takeover in September 2015. Energy Transfer arranged to borrow that $6 billion as a bridge loan from a consortium of banks in the autumn of last year, but by January, the market viewed the deal, and the debt necessary to finance it, as more of a risk than an opportunity. The hedge funds and dedicated MLP funds– which had once thought that the CEO of Energy Transfer could keep working his magic through large acquisitions–left in droves, driving the two stocks down an average of over 60% in the first 5 weeks of 2016. Such a large loss probably triggered selling in other holdings by the leveraged MLP-dedicated closed-end funds which in turn led to a lot of widespread panic. Although we didn’t own Williams or Energy Transfer in the fund, our phones were ringing off the hook.
But now, the mass liquidation of MLPs seems to have stopped for the time being. Outflows from MLP dedicated funds have reversed and (as of this writing) there have been about 8 weeks of steady inflows (source: U.S. Capital Advisors). Our phones are now quiet. I spoke at an investor conference in late March and shared the stage with someone who spoke just about crude oil prices and the other cyclical parts of the energy business. During the Q&A, I didn’t get a single question. The sound of wounded MLP momentum investors screaming in panic seems to have been replaced by the muffled sounds of value investors picking through the rubble.
Our Portfolio
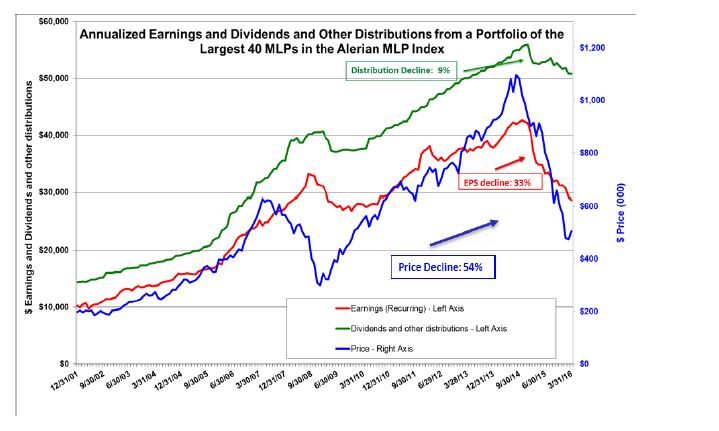
The graph below shows a simple time series of the composite earnings, dividends and price of the 40 largest MLPs by market cap in the Alerian MLP Index. As you can see, the earnings have declined about 33%, the dividends by about 9% and the price by about 54% from their respective highs. These 40 MLPs make up about 95% of the market cap of the Alerian MLP Index. The Alerian MLP Index is a cap-weighted index and so the larger, more successful MLPs have a greater weighting. So while the 33% decline in earnings is disappointing enough, an equally-weighted index would have performed much worse.
1 Past performance is not indicative of future results. Results include the reinvestment of dividends, interest and other earnings and are net of fees.
Exhibit 1: Earnings, Dividends and Price of the Alerian MLP Index – 15 Year History
Source: EIP calculations based upon Factset data for the 40 largest MLPs in the Alerian MLP Index. Portfolio based on $1 million at market capitalization as of December 31, 2014. Price decline of 54% from August 29, 2014 to March 31, 2016. EPS decline of 33% from October 31, 2014 to March 31, 2016. Distribution decline of 9% from December 31, 2014 to March 31, 2016. Earnings and dividends and other distributions are annualized. Past performance is no guarantee of future results. Not intended to represent the experience of any investor in any EIP managed account.
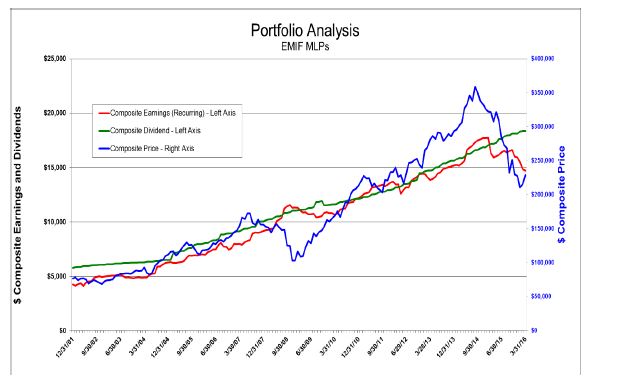
Notice also how the earnings today, 3/31/16, after this 33% decline, are about where they were 8 years ago. Now compare this to the 15 MLPs in our portfolio.
Exhibit 2: Earnings, Dividends and Price of the MLPs in EIP’s Portfolio – 15 Year History
This chart is provided for informational purposes only and should not be construed as an offer to sell, or a solicitation of an offer to buy, any investment and/or investment- related services. The performance information provided in this Portfolio Analysis represents the blended historical results of certain securities held by the Energy MLP Income Fund , LP (“EMIF”) as of 12/31/2014. Actual client holdings during the historical periods covered by the chart above deviated significantly from the portfolio noted above, both in terms of the names held in accounts and the respective weightings of those names as percentages of assets under management. This portfolio performance was created with the benefit of hindsight and does not represent the actual performance of clients, which may be materially less favorable during portions and/or the entirety of the period noted above. Past performance of the individual securities above should not be construed as any guarantee of future results. The model performance noted above does not include the reinvestment of dividends, interest and other income. The return data noted above does not reflect the deduction of fees and expenses that would have been paid if the portfolio was held in actual client accounts, including, but not necessarily limited to, advisory fees, brokerage expenses, and custody charges. MLPs are weighted based on its position in the EMIF portfolio as of 12/31/2014. Components are weighted as 0 if they did not exist during the specific time period.
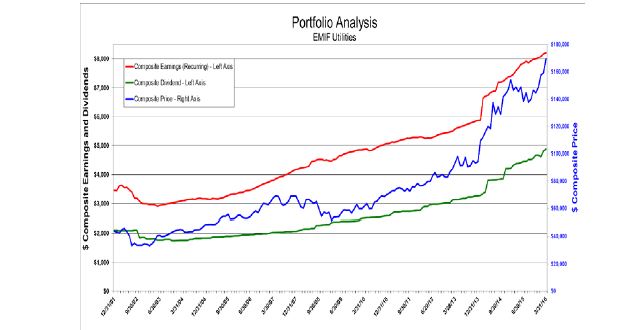
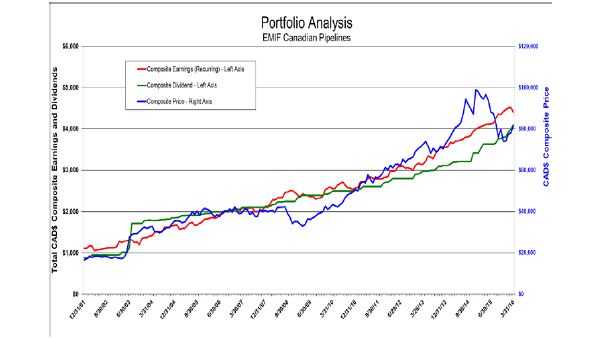
The earnings of the portfolio companies are faster growing and more stable than the other MLPs in the Alerian MLP Index because we don’t own the cyclical commodity companies in the Alerian MLP Index. The portfolio companies are higher quality and enjoy greater revenue stability as well, which is why the dividends are still growing. In fact, the only reason the earnings decline in the graph is so severe, is due to the recent changes we have made to the portfolio which increased its exposure to companies that have had some recent earnings declines, but whose stock prices have declined far more. Even with this decline, the earnings for the portfolio are nearly 60% higher than they were 8 years ago (vs. no increase as shown above for the components of the Alerian MLP Index). Keep in mind the portfolio also has a large exposure to pipeline companies in Canada and state-regulated electric and gas utilities in the US, which, as a group, have had steadily rising earnings and dividends. Comparable graphs of these other two categories of our portfolio are shown in the Appendix at the end of this letter.
But, for the MLP portion of the portfolio, the vast majority of the earnings derive from regulated pipeline tariffs and medium- and long-term contracts for other services (like storage). Nonetheless, the worry is that these backward-looking earnings do not reflect the risks of decline caused by the weakness in the oil and gas-producing segment, which is experiencing widespread credit rating downgrades by debt ratings agencies, and the first few bankruptcies. For certain supply-facing midstream operators, this risk is significant, but the vast majority of the tariffs on the pipelines of the portfolio companies are derived at the demand end of the system and paid for by refiners, marketers and state-regulated gas and electric utilities. Even if you own the Alerian MLP Index, your exposure to this risk is small, especially when compared to the declines in earnings that have already occurred in commodity-sensitive MLPs like oil and gas producers and natural gas processors, many of whose revenues are just as cyclical. Let’s go through the math. But first some background.
Counter Party Risk
The risk to pipeline operators from the weakness in the oil patch is generally thought of as counterparty risk since the conventional wisdom out there is that a rise in bankruptcies among oil and gas producers will lead to widespread abrogation of pipeline contracts, in general, and take-or-pay obligations, in particular. A recent case involving a bankrupt producer, Sabine Oil and Gas, was touted by the press as a precedent-setting harbinger of disaster for the pipeline industry. There was, in fact, nothing precedent setting in this case. When a company is in bankruptcy, the debtors, under the oversight of the bankruptcy judge, take control of the company and– under the US Bankruptcy code–have the right to abrogate any “executory” contract. An executory contract is a contract for which the company receives a product or service, (as opposed to a financing contract for borrowings). Only if the judge deems the reason for breaking a contract as “capricious” would the judge intervene. To quote from the judge’s opinion in the Sabine case: “The bankruptcy court generally defers to a debtor’s determination as to whether rejection of an executory contract is advantageous, unless the decision to reject is the product of bad faith, whim, or caprice”. Of course if the debtors who control the company cancel a contract for gathering and processing natural gas, then they need to secure another contract or the natural gas cannot be produced, processed, or sold. So, if the service is still required, it becomes a negotiation about price, the level of which will be determined by the bankrupt company’s alternatives.
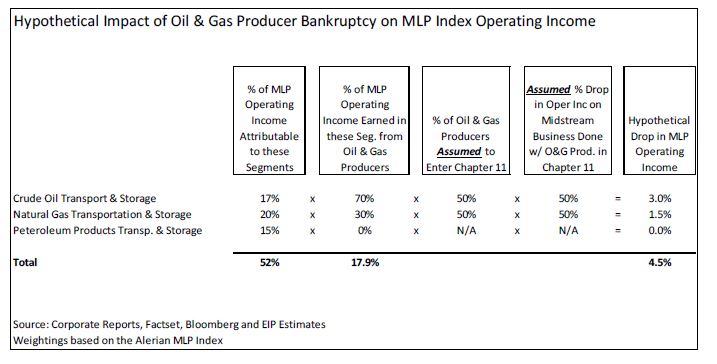
There is no question that there will be more cases like this. The issue is how much of the operating income of the pipeline industry is derived from oil and gas producers. If you own the components of the Alerian MLP Index, the answer is about 20%. So, if half of all that income is derived from oil and gas producers who end up in bankruptcy court and all of those contracts are abrogated and the renegotiated level results in operating income that is 50% lower, then there would be a 5% reduction to the operating income for the companies as weighted by the index (20% x 50% x 50%) = 5%.
Let’s go through why only 20% of the operating income of the Alerian MLP Index comes from oil and gas producers paying pipeline operators. There are three kinds of petroleum pipelines: crude oil, natural gas and petroleum products. Exhibit 3 shows the portion of operating income they contribute to the MLPs in the Alerian MLP Index, as weighted by that index. We do this calculation not by assigning a company to one of these three categories and adding up their market cap, we do it by breaking down the operating income of all the MLPs, pipeline corporations, utilities, etc. into 20 different business segments and then multiplying these percentages through by their weighting. In this exercise, the weighting we use is each company’s weighting in the Alerian MLP Index. Crude oil logistics may make up only 10% of one MLP’s operating income and over 80% of another’s. The largest MLP, Enterprise Products, derives significant operating income from all three types of pipelines. That’s why we go to the trouble of doing the analysis this way, so that we can more accurately measure the segment exposure of the portfolio. As far as we can tell, we are the only ones who do the analysis this way.
As Exhibit 3 shows, about 17% of the operating income of the Alerian MLP Index comes from crude oil logistics, 20% from natural gas (not including gathering and processing) and 15% from petroleum products. The next column shows the portion of those earnings derived from oil and gas producers. Notice that none of the operating income from petroleum products pipelines comes from producers, as all of this income is derived from refiners and marketers.
Exhibit 3
Only about 30% of the operating income for natural gas pipelines derives from producers, while the balance comes from state-regulated gas and power utilities. Interstate natural gas pipelines are required to report their tariffs, customers, length of contract, etc. to the Federal Energy Regulatory Commission every quarter so we know the portion of natural gas transmission paid for by producers vs. consumers (it’s a spreadsheet we developed with over 6000 rows). The consumers in this case are state-regulated utilities buying the gas to generate electricity or to resell to their retail customers. We have assumed intrastate pipelines have about the same split.
For crude oil logistics, we have estimated that no more than 70% of the operating income is derived from producers. There is no comparable reporting detail for crude oil pipelines, so our estimates are based on our industry knowledge and our discussions with companies. If anything, the estimate is high. Keep in mind that 45% of all crude oil used in the U.S. is imported. For the shipment of domestically-produced crude oil, refiners pay for a large portion of the tariffs on crude oil pipelines. For example, the Express Platte crude oil pipeline that runs from Alberta to southern Illinois gets 90% of its operating income from refiners who use that pipeline. Most of the pipelines leading to Houston from Cushing, Oklahoma, the largest crude oil supply node, are paid for by refiners. Most, if not all, of the pipelines and storage in and around the Houston Ship Channel are paid for by the refiners who use them.
Multiplying the portion of operating income from each of these three types of pipelines by the portion paid for by producers results in less than 20% of the operating income for the Alerian MLP Index that is derived by pipeline tariffs paid for by oil and gas producers. So let’s talk about counterparty risk.
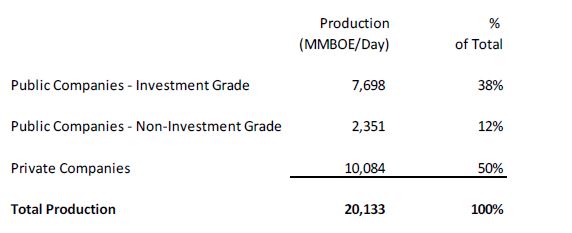
Exhibit 4 shows the breakdown of oil and gas production by public and private companies; about half of all production comes from private companies with no public equity and very little in the way of public debt.
Exhibit 4: Credit Quality Composition of US Oil & Gas Production
Source: Factset, Bloomberg and EIP Estimates. MMBOE: Million Barrels of Oil Equivalent. As of 12/31/2015.
While the bulk of the production from public companies is investment grade, the portion that is non-investment grade is growing as companies are being downgraded by the rating agencies. The largest 40 companies account for about half of all production, the other half is made up of thousands of companies. So if we imagine a disaster scenario where half of all oil and gas production companies end up in bankruptcy, it would mean about 99% of all oil and gas companies are bankrupt. If we then assume that in each bankruptcy case the debtors renegotiate their deal with their pipeline providers for a 50% reduction in operating income, then, as shown in Exhibit 3, it would represent a 5% drop in operating profit for an investor who held the Alerian MLP Index. Since our portfolio is more diversified and more tilted to the demand end of the logistic system, including our large weighting in utilities, the impact on our portfolio would be even less.
Nonetheless, there are certain midstream companies that have large exposures to take or pay contracts with oil and gas producers. Williams is one example. Williams bought the midstream company spun out by Chesapeake Energy known as Access Midstream, L.P. Access Midstream was created when Chesapeake sold half its interest in its gas gathering and processing business to a private equity company that required these take or pay obligations as part of the deal. These contracts represent nearly 20% of Williams’ operating income but they are not representative of how the gathering and processing sector typically works. In most cases, the gas processor actually pays the producer a portion of the proceeds from selling the processed natural gas and the ethane, propane, butane, etc. that are extracted from the raw gas.
Crude oil gathering works in a similar way. When Plains All American picks up crude oil out in the field with a truck, Plains purchases the crude oil, drives it to the front end of one of their own pipelines, moves it through that pipeline to a market hub like Cushing, Oklahoma and resells it to a refiner or commodity trader. Plains will hedge the price exposure of this crude for the period of time it owns it. So in each case, at the gathering and initial processing, the midstream provider is paying the producer most of the time, not the other way around. There are exceptions for certain companies like Chesapeake and in certain areas like the Marcellus/Utica shale formation where the midstream operator receives a fee, but the vast majority of the gathering activities involve the midstream service provider paying the producer. Once the hydrocarbons are in a long-haul pipeline, the majority of those tariffs are being paid for by utilities, refiners, marketers and commodity traders, not the oil and gas producers. While this is contrary to what press reports are implying about the risks to midstream operators, keep in mind those reporters do not have the time or the expertise to understand the mechanics of how these industries work in this kind of detail. But this detailed knowledge is an integral part of how we select portfolio companies and construct a diversified portfolio that has successfully avoided most of the risks associated with supply-facing processing businesses that have variable margins and a lot of credit risk.
Best Regards,
James J Murchie
Past performance is not indicative of future results. Performance information provided for the Energy MLP Income Fund (EMIF or the “Fund”) assumes the reinvestment of interest, dividends and other earnings and is net of fees. There is no assurance that the Fund’s investment objective will be achieved.
The EMIF portfolio information regarding dividends and portfolio company prices is provided as an example of EIP’s investment philosophy and strategy and not an offer or sale of any security. Information in this letter regarding specific MLP instruments and other companies, including any information pertaining to the performance of such instruments and other companies, is provided solely as a tool for general industry analysis. Under no circumstances should it be assumed that the Fund or any other account managed by Energy Income Partners, LLC derived any benefit from the performance of any MLP or company referenced herein.
CIRCULAR 230 NOTICE. THE FOLLOWING NOTICE IS BASED ON U.S.TREASURY REGULATIONS GOVERNING PRACTICE BEFORE THE U.S. INTERNAL REVENUE SERVICE: (1) ANY U.S. FEDERAL TAX ADVICE CONTAINED HEREIN, INCLUDING ANY OPINION OF COUNSEL REFERRED TO HEREIN, IS NOT INTENDED OR WRITTEN TO BE USED, AND CANNOT BE USED, BY ANY TAXPAYER FOR THE PURPOSE OF AVOIDING U.S. FEDERAL TAX PENALTIES THAT MAY BE IMPOSED ON THE TAXPAYER; (2) ANY SUCH ADVICE IS WRITTEN TO SUPPORT THE PROMOTION OR MARKETING OF THE TRANSACTIONS DESCRIBED HEREIN (OR IN ANY SUCH OPINION OF COUNSEL); AND (3) EACH TAXPAYER SHOULD SEEK ADVICE BASED ON THE TAXPAYER’S PARTICULAR CIRCUMSTANCES FROM AN INDEPENDENT TAX ADVISOR.
These materials do not constitute an offer of securities. Such an offer will only be made by means of the Confidential Memorandum to be furnished to prospective investors at a later date. This document is confidential and is intended solely for the information of the person to whom it has been delivered. It is not to be reproduced or transmitted, in whole or in part, to third parties, without the prior written consent of the Fund. Notwithstanding anything to the contrary herein or in the Confidential Memorandum, the recipient (and each employee, representative or other agent of such recipient) may disclose to any and all persons, without limitation of any kind, the tax treatment and tax structure of (i) the Fund and (ii) any transactions described herein, and all materials of any kind (including opinions or other tax analyses) that are provided to the recipient relating to such tax treatment and tax structure.
A description of the Alerian MLP Total Return Index may be found at http://www.alerian.com/indices/amz-index/. The index performance is provided for information purposes only. The index is not a benchmark and there is no correlation between the index and the Fund.
The Wells Fargo Midstream MLP Total Return Index consists of 35 energy MLPs and represents the Midstream sub-sector of the Wells Fargo MLP Composite Index. The index is calculated by S&P using a float-adjusted market capitalization methodology. Unlike the Fund, the index does not incur fees and expenses.
Appendix
Exhibit A-1 EIP’s 18 Utilities
This chart is provided for informational purposes only and should not be construed as an offer to sell, or a solicitation of an offer to buy, any investment and/or investment- related services. The performance information provided in this Portfolio Analysis represents the blended historical results of certain securities held by the Energy MLP Income Fund, LP (“EMIF”) as of 12/31/2014. Actual client holdings during the historical periods covered by the chart above deviated significantly from the portfolio noted above, both in terms of the names held in accounts and the respective weightings of those names as percentages of assets under management. This portfolio performance was created with the benefit of hindsight and does not represent the actual performance of clients, which may be materially less favorable during portions and/or the entirety of the period noted above. Past performance of the individual securities above should not be construed as any guarantee of future results. The model performance noted above does not include the reinvestment of dividends, interest and other income. The return data noted above does not reflect the deduction of fees and expenses that would have been paid if the portfolio was held in actual client accounts, including, but not necessarily limited to, advisory fees, brokerage expenses, and custody charges. Utilities are weighted based on its position in the EMIF portfolio as of 12/31/2014. Components are weighted as 0 if they did not exist during the specific time period.
Exhibit A-2 EIP’s 5 Canadian Pipeline Companies
This chart is provided for informational purposes only and should not be construed as an offer to sell, or a solicitation of an offer to buy, any investment and/or investment- related services. The performance information provided in this Portfolio Analysis represents the blended historical results of certain securities held by the Energy MLP Income Fund , LP (“EMIF”) as of 12/31/2014. Actual client holdings during the historical periods covered by the chart above deviated significantly from the portfolio noted above, both in terms of the names held in accounts and the respective weightings of those names as percentages of assets under management. This portfolio performance was created with the benefit of hindsight and does not represent the actual performance of clients, which may be materially less favorable during portions and/or the entirety of the period noted above. Past performance of the individual securities above should not be construed as any guarantee of future results. The model performance noted above does not include the reinvestment of dividends, interest and other income. The return data noted above does not reflect the deduction of fees and expenses that would have been paid if the portfolio was held in actual client accounts, including, but not necessarily limited to, advisory fees, brokerage expenses, and custody charges. Canadian Pipelines are weighted based on its position in the EMIF portfolio as of 12/31/2014. Components are weighted as 0 if they did not exist during the specific time period.
