Energy MLP Income Fund, LP
3Q 2017 Letter to Investors
Performance
The Energy MLP Income Fund, LP (“EMIF”) was up 0.45% (net of fees) this quarter.[1] This compares to the Alerian MLP Total Return Index (“AMZX”) which was down 3.05% and the Wells Fargo Midstream MLP Total Return Index (“WCHWMIDT”) which was down 3.31% over the same period. [2]
While the SEC requires us to use a benchmark when reporting our performance, bear in mind that nearly 50% of our portfolio is not in the broader Alerian MLP Index. The balance of the portfolio is in companies not formed as partnerships involved in transmission and storage of hydrocarbons and the transmission and distribution of electric power. This ratio is also affected by companies that merged their MLPs with their C-Corp parents and stayed in the portfolio, such as Oneok and Kinder Morgan.
While movements in the equity markets in general, rotations between sectors, interest rate expectations and commodity prices all have the ability to move our portfolio day-to-day, the yield of the portfolio combined with capital appreciation – ultimately, driven by earnings and dividend growth – drive our long-term returns.
Renewable Energy Threats and Opportunities
We’re often asked if renewable energy affects our investment portfolio (yes, somewhat) or our investment approach (not at all). In prior letters, I have discussed how we invest in the North American energy sector, in particular, the non-cyclical segments via sleeves of equity capital that align with our core total return objective; poles and wires, pipes and tanks, in a high-dividend payout structure. In addition, we have, at length, written about how our portfolio is biased towards the demand-end of the hydrocarbon and electric logistics systems, as we find the cash-flows more stable and predictable, and the counter-parties more credit worthy. And in a more general sense, we seek to own the low-cost way of transporting the lowest- cost energy, as we don’t want to fall victim to substitutes. In fact, I think it is this substitution effect that underlies the questions we get and the concerns investors have regarding the electric power sector, as they see renewable energy sources as a threat to incumbent players. If electricity demand were growing at 5% per year, these changes might be viewed differently. But without demand growth, it is perceived as a zero-sum game where someone has to lose.
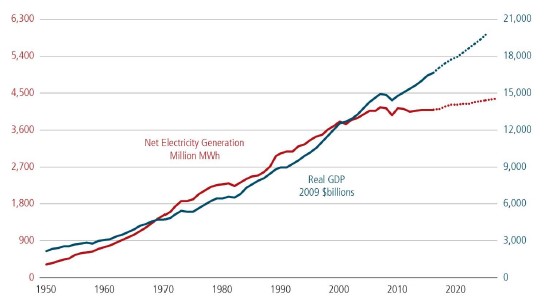
As a backdrop, Exhibit 1 shows a long history of U.S. electricity production, along with gross domestic product (GDP). The graph shows how dramatic changes in efficiency as well as the long-term shift towards a more service-oriented economy — as Alan Greenspan said “GDP gets lighter every year” – have caused a flattening of the trend in electricity demand relative to the economy.
Exhibit 1: US Electricity Production vs. GDP
| Source: U.S. Department of Energy Staff Report on Electricity Markets and Reliability, August 2017 |
Moreover, there is all this talk about battery technology that will allow people to disconnect their homes from the “grid”.
The short answer to these concerns is that we are benefitting from these changes in our holdings of poles and wires utilities as well as being the second largest shareholder of the largest renewable development company in North America. But the long answer is more interesting and provides some insights into the dramatic changes that on the one hand, have occurred over the last decade in the cost of wind and solar generation, and on the other hand, battery storage.
Market Structure
Before addressing the concerns created by new solar and wind supply that has been heavily subsidized, it’s important to review the basic market structure of the electric power business. In the U.S., the business of transmitting and distributing electricity over poles and wires has always been, and continues to be, a legal monopoly. Companies that own and operate these assets do so on a “cost of service” pricing model. That means that the customers pay for their electricity at a price that covers the operating costs as well as the capital costs of equipment, known as the “rate base”. Commodity prices and volumes have little to no effect on what they earn. The cost of debt financing is passed through to customers, as is a “fair and reasonable profit” on the shareholders’ equity (which today averages about 10% [Source: Edison Electric Institute]. In the past, you have heard me refer to them as regulatory asset base (RAB) businesses. They are also referred to as “utility” businesses as Warren Buffet does in his annual letters like this passage from the 2005 letter: …utilities [are] usually the sole supplier of a needed product and [are] allowed to price their product at a level that [gives] them a prescribed return upon the capital they employed. The joke in the industry [has been] that a utility was the only business that would automatically earn more money by redecorating the boss’s office.
This cost-of-service model is used around the world for natural monopolies such as water systems, pipelines, highways and electric systems where high infrastructure costs and barriers to entry give the largest supplier an overwhelming advantage over competitors. These natural monopolies are prone to be sources of market failure, and that is why the alternative tends not to be a normal merchant business model but government ownership to make them serve the public good. In fact, in the U.S., over 80% of the water systems are owned by state and local governments [American Water Works company data].
Up until the deregulation and privatization wave that began around the world in the early 1980s, the generation of electricity in the U.S. was also (almost universally) operated under a cost-of-service model. Cost overruns in the U.S. led to legislative changes that allowed competition in the production of electricity. This ushered in what are known as independent power producers or IPPs. It was left to the states to decide whether or not they wanted the power generation assets of their legacy vertically-integrated (i.e. companies that operate generation, transmission and distribution) investor-owned utilities to remain as a cost-of-service business or be excluded from a utility’s “rate base” (the assets upon which they earn their fair and reasonable profit) and become a full merchant business operating as an IPP that would be free to sell its electricity output in the open market, but would sacrifice the sure profit of regulated returns.
Regional transmission organizations (RTOs) were set up to be traffic cops making sure that these free market players were getting proper access to the transmission and distribution systems that remained as legal monopolies run by the legacy utility companies. Wholesale power markets came into being with rules of the road which, over time, have evolved. But like all wholesale commodity markets, the price of electricity is a highly cyclical and variable margin business.
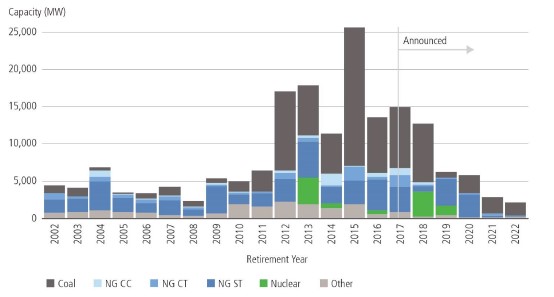
As we have discussed before, merchant power prices are driven by the cost of production for swing producers, which results in the price of electricity being highly correlated to natural gas prices which have collapsed, primarily as a result of the exploitation of the large shale gas fields. As a result, the price of wholesale electricity has plummeted from about 6 cents-8 cents per kilowatt hour 10 years ago, to just over 3 cents per kilowatt hour today [Source: U.S. Department of Energy, Energy Information Administration]. This pricing pressure has led to the closure of numerous higher-cost plants, most of which burn coal, as shown below in Exhibit 2.
Exhibit 2: US Power Generation Retirements by Power Source
| Source: U.S. Department of Energy Staff Report on Electricity Markets and Reliability, August 2017
NG CC: Natural Gas Combined Cycle; NG CT: Natrual Gas Combined Cycle Combustion Turbine; NG ST: Natrual Gas Steam Turbine |
In addition, it led to the largest bankruptcy in history of a U.S. private equity company, TXU Corp. (formerly Texas Utilities), which changed its name to Energy Future Holdings. Furthermore, it led to a steady and significant shift in ownership of these merchant power plants away from the legacy vertically-integrated investor owned utilities like Duke and American Electric Power and toward private equity and a shrinking number of ever-larger IPPs like Dynegy, Calpine and NRG Energy.
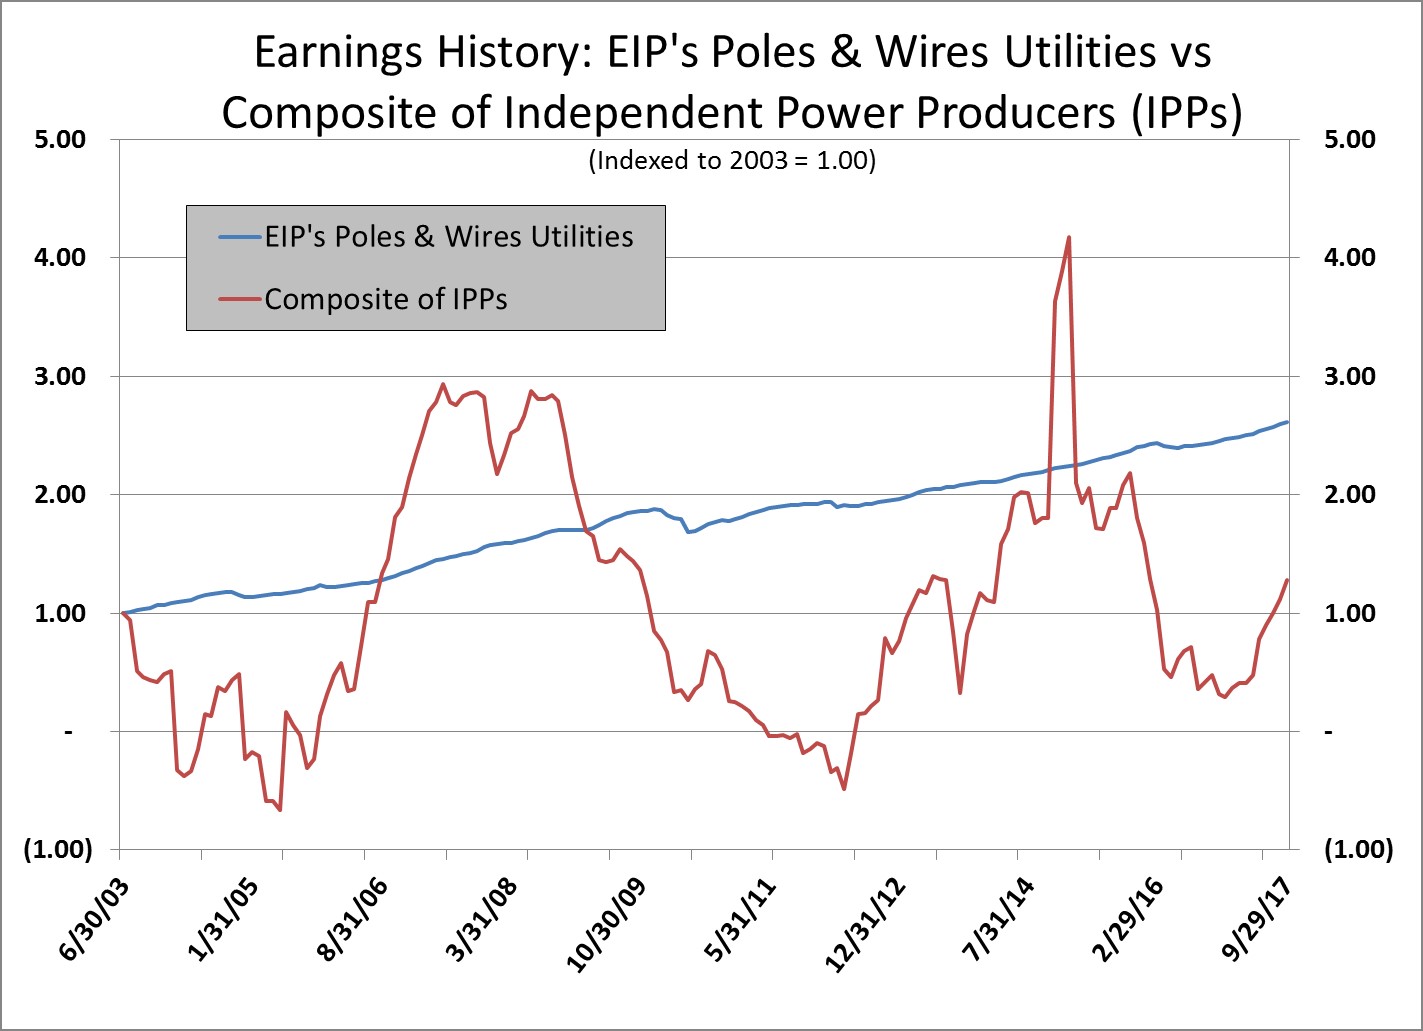
The disruption in the electric power markets can be seen in the earnings trajectories in Exhibit 3 which compares the earnings of a composite of independent power producers (IPPs) with a composite of the poles and wires utilities in our portfolio. Notice the vicious cyclicality (and lack of growth) of the IPP group compared to the smooth trajectory of the poles and wires group.
Exhibit 3: Earnings History of Independent Power Producers vs. Poles & Wires
| Source: Bloomberg, Factset, EIP Estimates.
The Composite of Independent Power Producers was created by EIP and consists of four companies in the Bloomberg North America Independent Power Producers Valuation Peers (BIIPUTNV). EIP in its sole discretion determined whether a company falls within the composite. The names in the composite may or may not be included in any EIP managed portfolio. The data provided for the EIP’s Poles and Wires Utilities is based on EIP Calculations based upon Factset data for EIP’s Poles and Wires Utilities held by the Energy MLP Income Fund, LP (EMIF) portfolio as determined by EIP. EMIF portfolio holdings during the historical periods covered by the chart above deviated significantly from the portfolio noted above, both in terms of the names held in accounts and the respective weightings of those names as percentages of assets under management. The information provided for EIP’s Poles and Wires Utilities performance was created with the benefit of hindsight and does not represent the actual client experience, which may be materially less favorable during portions and/or the entirety of the period noted above. The return data noted above does not reflect the deduction of fees and expenses that would have been paid if the EMIF portfolio was held in actual client accounts, including, but not necessarily limited to, advisory fees, brokerage expenses, and custody charges. Earnings, dividends and other distributions are annualized. Past performance of the individual securities in the model or the model information noted above should not be construed as any guarantee of future results. Past performance is no indication of future performance. The information provided is current as of the date provided and may change at any time without notice and in EIP’s sole discretion. |
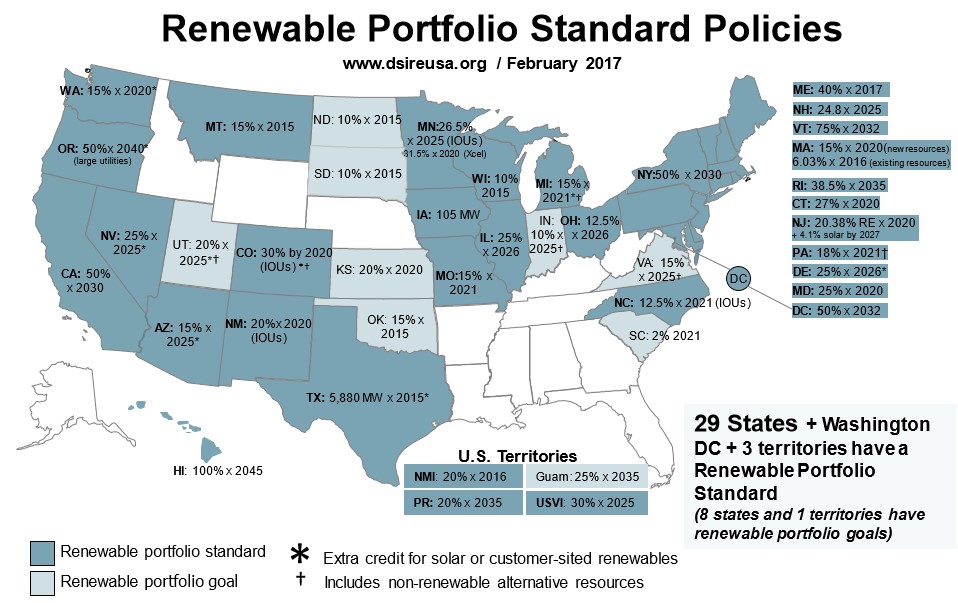
It is at this point in the story that we introduce another disruptive force: renewables. While the cost of renewables has declined dramatically, making them more competitive with conventional power sources, their introduction 10-15 years ago was only possible due to government intervention. This intervention took two basic forms. The first form of intervention is mandates by 29 states that a certain portion of electric power must come from renewable energy sources. A map of the U.S. showing these so-called “renewable portfolio standards” (RPS) is shown in Exhibit 4.
Exhibit 4: Renewable Mandates for Electric Power
| Source: U.S. Department of Energy / NC Clean Energy Technology Center |
The second form of intervention is subsidies in the form of tax credits. One tax credit lowered the cost of investment through investment tax credits (ITCs) and the other provided an extra source of revenue per kilowatt hour actually produced (known as the production tax credit or PTC).
Based on this perspective of market structure, one can see that the threats related to any new source of lower cost power generation, renewable or otherwise, is a threat to merchant power producers, whether they be independent or whether they be the power generation business of a hybrid utility that owns and operates both poles and wires and merchant power. This is analogous to the fortunes of oil and gas producers following the technological sea change that is the shale revolution: Their volumes are all higher, but the lower price has crushed their collective earnings. And just as a pipeline is better off when the hydrocarbons it ships are lower in price so as to be competitive with alternatives, so, too, is a poles-and-wires utility better off when the electricity it is shipping is competitive with alternatives. The battle that is playing out on the supply side in both hydrocarbon production and electricity production is good for companies that operate demand-facing pipelines and demand-facing power transmission and distribution.
So, just as we seek to avoid oil and gas producers and supply-facing hydrocarbon infrastructure, we also seek to minimize exposure to merchant power generation. The opportunity lies in being the low-cost transporter of the lowest cost source of energy. The lower the cost, the less we need to worry about substitutes.
Investment Opportunities Created by Renewables
But avoiding the harm from renewables is a long way from benefitting from them. Again, we need to go back to the cost-of-service model. In this model, a company can grow its earnings above inflation only if it can get higher allowed returns, or if it can grow its rate base on a per share basis.
The graph in Exhibit 5 shows the capital expenditure growth for the largest electric and gas utilities in North America.
Exhibit 5: Capital Expenditure Growth for the Largest North American Utilities
 Source: Factset, EIP Estimates.
We include the gas utilities for completeness, as many utilities such as Duke, have power and gas distribution assets.
But what is causing this growth? Why, if electricity demand is flat, do we need to be spending any money other than sustaining capital?
One reason is the changes in new sources of electric power. The maps below in Exhibit 6 show the changes to where power is being generated in the U.S. The first map shows closures of power plants where the color of the circle denotes the energy source (dark gray for coal) and the size of the circle indicates the size – in gigawatts – of the plant. The second map shows where the new sources are coming from. While natural gas- fired plants represent a significant portion of the new generation, so ,too, do wind and solar. Since the population will, of course, not change its location, more electric transmission and natural gas transport assets are needed.
Exhibit 6: Changes in US Power Generation
Sources: U.S. Energy Information Administration, Form EIA-860, Annual Electric Generator Report and Form EIA-860M, Monthly Update to the Annual Electric Generator Report. Electric Power Monthly February 2015
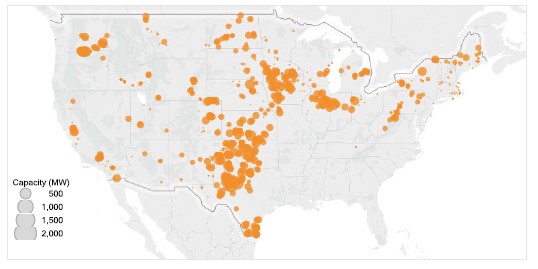
Focusing solely on wind power, Exhibit 7 shows where the wind power assets are located. Wind power is concentrated where – go figure – it’s windy. And where it’s windy doesn’t always match up population centers.
Exhibit 7: Location of Existing Wind Fleet
Source: U.S. Department of Energy Staff Report on Electricity Markets and Reliability, August 2017
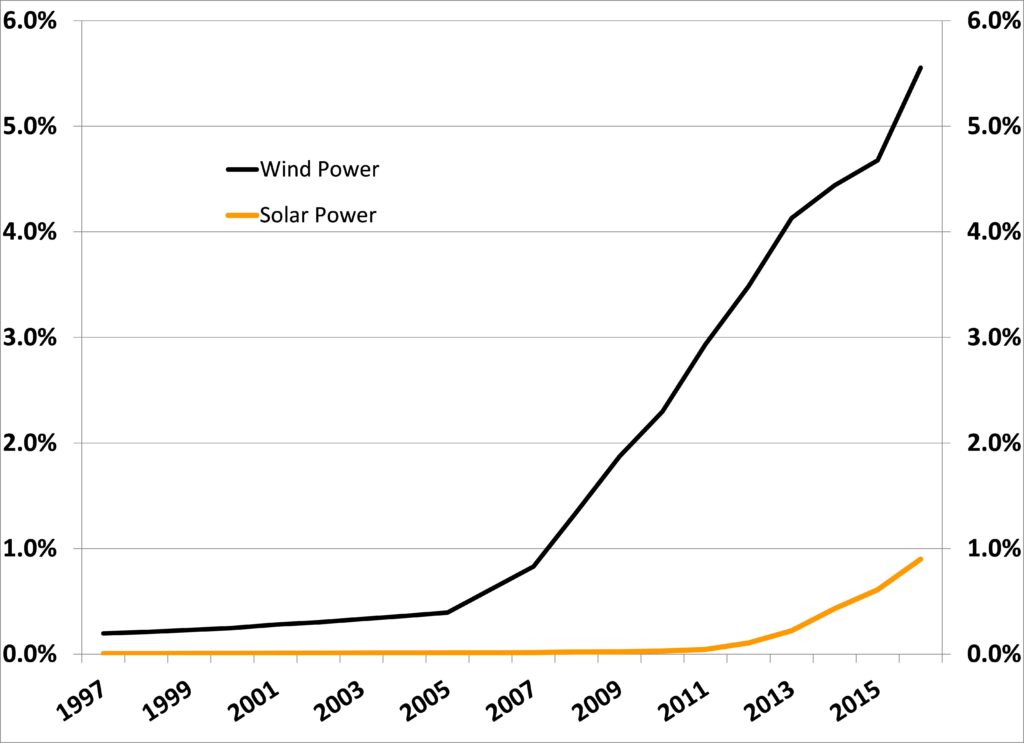
Exhibit 8 shows the growth in wind and solar as a percent of U.S. power generation.
Exhibit 8: Wind and Solar as a Percent of U.S. Power Generation
 Source: U.S. Department of Energy, Energy Information Administration. Electric Power Monthly August 2017
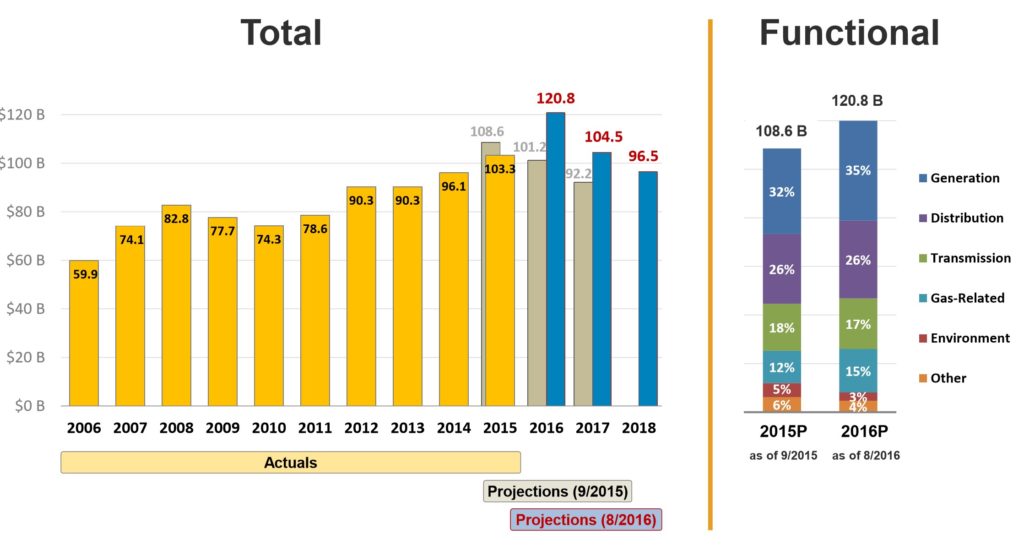
These shifts in the location of where power is generated have led to the need for new investment, as shown below in Exhibit 9.
Exhibit 9: Capital Spending on Electric Transmission and Distribution
 Source: U.S. Department of Energy Staff Report on Electricity Markets and Reliability, August 2017
But what about costs? If all this new wind and solar needs subsidies, investing in new transmission to hook up this high-cost source of power could turn out to be a poor investment, if and when subsidies come to an end.
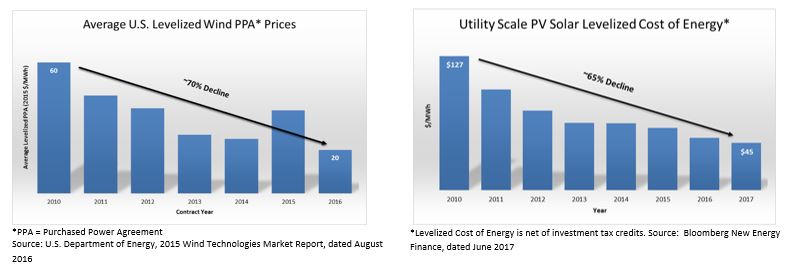
As it turns out, subsidies are coming to an end – under the current tax law, the tax credits begin stepping down this year and will phase out in 2020. However, since the costs of solar and wind have come down so much, they are still expected to be competitive as shown in the graphs in Exhibit 10.
Exhibit 10: The Declining Costs of Wind and Solar Power Generation
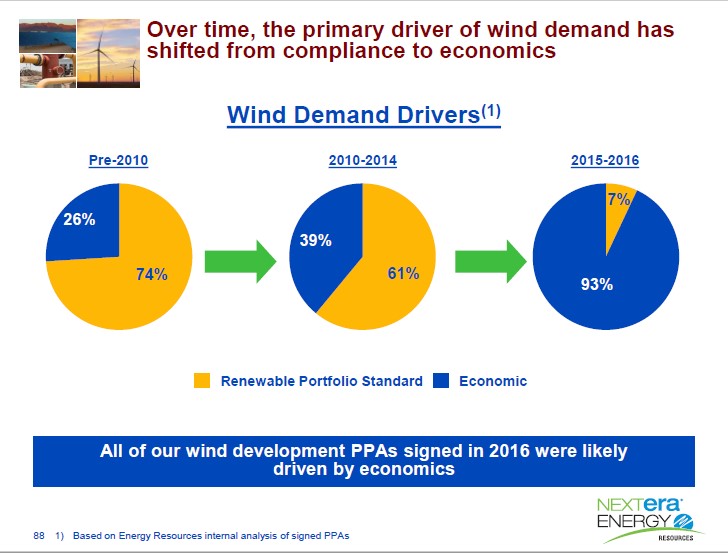
In the past five years, these declines in costs are driving a shift in the demand for renewables. As shown in Exhibit 11, prior to 2010, about three-quarters of the wind projects NextEra Energy developed were due solely to the requirements to meet Renewable Portfolio Standards. In the last two years, only 7% were built for that reason. Going forward, nearly all wind projects that NextEra Energy develops will be driven by the competitive cost of those projects.
Exhibit 11: Changes in What’s Driving Renewable Adoption
 Source: 2017 NextEra Investor Day Presentation
We use NextEra Energy’s numbers because they are the largest and most successful developer of renewables in the U.S. Over the years, we have seen all kinds of numbers from groups pushing an environmental agenda, showing how renewables are cheaper, while conveniently leaving out the massive subsidies that go into the equation.
Since the power from these projects is sold under 25-year contracts or are put into the rate base of the local utilities, they make for an attractive asset for our portfolio. So, going back to the quote from Warren Buffett, the regulated utilities will grow their earnings if they can grow their regulatory asset base (RAB) or rate base on a per share basis. The need for more transmission and distribution is driving that growth. The declines in power costs prevent that growth from increasing customers’ bills in a world where electricity demand is not growing.
But as renewables grow as a percent of the electricity generated, they create the need for investment in other equipment as well, besides more poles and wires. Renewables are intermittent in their generation, which creates a need for battery storage, another technology that is rapidly coming down the cost curve. Many of these resources produce direct current (DC), requiring inverters and other equipment to synchronize with the alternating current (AC) grid. Moreover, these new sources are many in number and some, like solar, increasingly, are installed at the demand end of the distribution system. These changes require more robust data gathering and intelligent, real-time management of bidirectional electricity flows between sources and uses. The poles and wires (distribution) utility is emerging as the logical grid network operator, providing another area of rate base growth.
Going Off-Grid
But won’t the increased penetration and cost advantages of rooftop solar and battery storage cause mass defections from the grid, stranding those billions of dollars of utility investment? Again, it comes down to economics. In a recent research report, Wells Fargo calculated what it would cost to install enough solar panels and battery storage to allow an average U.S. residential electricity customer to disconnect from the grid. The answer? Between $90,000 and $100,000, nearly half the median U.S. home price [Source:“Meaningful Customer Migration Off The Grid Appears Unlikely,” Wells Fargo Equity Research, July 2017]. Or, a 60-plus year payoff based on average monthly electricity bills in New England, home to the nation’s highest power prices.
That analysis was based on average U.S. residential electricity consumption of 901 kilowatt-hours per month, which costs an average of about $1200 per year. In order to meet that need with no grid connection, Wells Fargo calculated that an average residence would need about 40 kilowatts of solar panel capacity and 150 kilowatt hours of battery storage to be able to ride through a five-day period of reduced solar output due to sustained cloudy conditions in the winter—a condition not at all unfamiliar to those of us who live in New England [Source: “Meaningful Customer Migration Off The Grid Appears Unlikely,” Wells Fargo Equity Research, July 2017]. Why so much solar capacity? Absent of a grid connection, the solar panels have to not only power the house when the sun is shining, they also have to recharge the batteries that take over when the sun sets.
It makes a whole lot more sense—for the consumer as well as the utility—to use rooftop solar to shave peak demand while remaining connected to a broader network of shared resources. The return on any capital investment is proportional to utilization; in order to replicate the reliability, resilience and responsiveness of a utility connection, the “off-grid” homeowner would need to invest heavily in equipment that would go underutilized most of the time.
Recognizing that people make economically irrational decisions all the time, we took this analysis a step further to estimate the potential impact on U.S. electricity sales, if half of the homeowners who had the means (and the rooftop) to go off-grid actually did. Based on census, housing, and DOE data, potential “cord cutters” represent about 12% of residential electricity usage. Residential usage accounts for 38% of U.S. consumption, so, if half of those customers decided to go it alone, it would reduce U.S. electricity sales by 2.3% (12% X 38% X 50%). Based on average U.S. residential electricity prices, a 3,500 square-foot home could save $2,450 per year by going off-grid. Compare that to the interest cost (much less recovery of capital) of $4,500 per year ($90,000 investment at 5%) [Source: U.S. Department of Energy, Energy Information Administration Average Monthly Residential Electricity Bills, 2015 and EIP estimates].
Wrapping-Up
The U.S. electric utility sector is rapidly evolving away from a one-way radial system of large power plants to a more distributed network model. Despite this, many fundamental principles remain; electricity remains a scale business that favors economic efficiency through optimal use of shared resources across an interconnected grid, and supply (generation) remains – from an investor’s perspective – the volatile end of the system. Contrary to the views of many predicting its demise, the grid of poles and wires (as well as switches, transformers, voltage control, inverters, etc.) is emerging as an essential enabler of newer, lower cost technologies despite flat to declining volume growth. Even the Internet runs on electricity.
In short, poles and wires monopolies benefit from the changes, while it is the merchant power producers who are threatened. And like any logistics business, the demand end of the system benefits as low commodity prices allow new investment that, ultimately, drives earnings and dividend growth from legal monopolies that grow their earnings from increases in their rate base investment.
Best regards,
James J Murchie
Past performance is not indicative of future results. Performance information provided for the Energy MLP Income Fund (EMIF or the “Fund”) assumes the reinvestment of interest, dividends and other earnings and is net of fees. There is no assurance that the Fund’s investment objective will be achieved.
The EMIF portfolio information regarding dividends and portfolio company prices is provided as an example of EIP’s investment philosophy and strategy and not an offer or sale of any security. Information in this letter regarding specific MLP instruments and other companies, including any information pertaining to the performance of such instruments and other companies, is provided solely as a tool for general industry analysis. Under no circumstances should it be assumed that the Fund or any other account managed by Energy Income Partners, LLC derived any benefit from the performance of any MLP or company referenced herein. Information provided is believed to be accurate as of the date on the materials. EIP reserves the right to update, modify or change information without notice. The information is based on data obtained from third party publicly available sources that EIP believes to be reliable but EIP has not independently verified and cannot warrant the accuracy of such information. This Document is not an offer or solicitation with respect to the purchase or sale of any security. This Document is strictly confidential and may not be reproduced or redistributed in whole or in part nor may its contents be disclosed to any other person under any circumstances. This Document is not intended to constitute legal, tax, or accounting advice or investment recommendations of any particular security or industry. Investors are encouraged to conduct their own analysis before investing.
CIRCULAR 230 NOTICE. THE FOLLOWING NOTICE IS BASED ON U.S.TREASURY REGULATIONS GOVERNING PRACTICE BEFORE THE U.S. INTERNAL REVENUE SERVICE: (1) ANY U.S. FEDERAL TAX ADVICE CONTAINED HEREIN, INCLUDING ANY OPINION OF COUNSEL REFERRED TO HEREIN, IS NOT INTENDED OR WRITTEN TO BE USED, AND CANNOT BE USED, BY ANY TAXPAYER FOR THE PURPOSE OF AVOIDING U.S. FEDERAL TAX PENALTIES THAT MAY BE IMPOSED ON THE TAXPAYER; (2) ANY SUCH ADVICE IS WRITTEN TO SUPPORT THE PROMOTION OR MARKETING OF THE TRANSACTIONS DESCRIBED HEREIN (OR IN ANY SUCH OPINION OF COUNSEL); AND (3) EACH TAXPAYER SHOULD SEEK ADVICE BASED ON THE TAXPAYER’S PARTICULAR CIRCUMSTANCES FROM AN INDEPENDENT TAX ADVISOR.
These materials do not constitute an offer of securities. Such an offer will only be made by means of the Confidential Memorandum to be furnished to prospective investors at a later date. This document is confidential and is intended solely for the information of the person to whom it has been delivered. It is not to be reproduced or transmitted, in whole or in part, to third parties, without the prior written consent of the Fund. Notwithstanding anything to the contrary herein or in the Confidential Memorandum, the recipient (and each employee, representative or other agent of such recipient) may disclose to any and all persons, without limitation of any kind, the tax treatment and tax structure of (i) the Fund and (ii) any transactions described herein, and all materials of any kind (including opinions or other tax analyses) that are provided to the recipient relating to such tax treatment and tax structure.
A description of the Alerian MLP Total Return Index may be found at http://www.alerian.com/indices/amz-index/. The index performance is provided for information purposes only.
The Wells Fargo Midstream MLP Total Return Index consists of 53 energy MLPs and represents the Midstream sub-sector of the Wells Fargo MLP Composite Index. The index is calculated by S&P using a float-adjusted market capitalization methodology.
The indices have not been selected to represent an appropriate benchmark with which to compare an investor’s performance, but rather are disclosed to allow for comparison of the investor’s performance to that of certain well-known and widely recognized indices. An index is unmanaged, does not incur fees or expenses and an investment cannot be made directly in an Index.
The information presented is not intended to constitute an investment recommendation for, or advice to, any specific person. By providing this information, EIP is not undertaking to give advice in any fiduciary capacity within the meaning of ERISA and the Internal Revenue Code. EIP has no knowledge of and has not been provided any information regarding any investor. Financial Advisors must determine whether particular investments are appropriate for their clients. EIP believes the financial advisor is a fiduciary, is capable of evaluating investment risks independently and is responsible for exercising independent judgment with respect to its retirement plan clients.
[1] Past performance is not indicative of future results. Results include the reinvestment of dividends, interest and other earnings and are net of fees.
[2] Indices do not incur fees and expenses.
