Everyone knows about “F.A.A.N.G.”: Facebook, Amazon, Apple, Netflix and Google. But there is an oil and gas producer with a similar ticker: FANG, Diamondback Energy, which, like the rest of conventional energy is getting more attention these days.
Table 1 – S&P Oil & Gas Producers ETF (XOP) vs S&P Technology ETF (XLK)

Why? In our view it’s because energy stock prices are beginning to reflect the fundamental signals one needs to invest in a value group like this: cheap valuations, improving earnings and very little in the way of a supply response which eventually brings long trades in energy producers to an end. And for the chart readers out there: a rising 200-day moving average off a very low base.
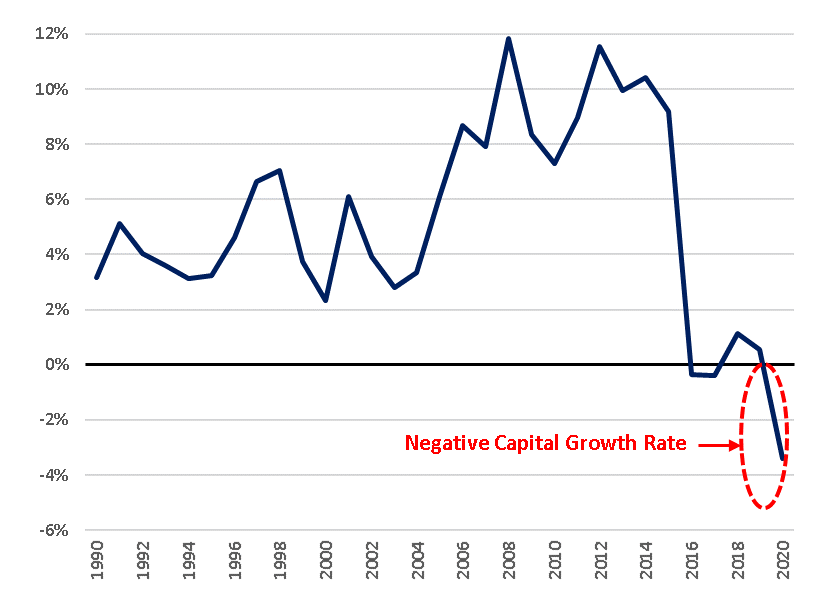
Let’s be clear: We are not investors in the upstream oil and gas industry, and we are not chart technicians; we are investors in energy infrastructure and typically stay as far away from cyclical competitive merchant businesses as prudent portfolio construction demands. But what generalist investors rarely seem to get is that the best returns come when the petroleum industry is NOT trying to grow. In fact, as the chart in Table 2 shows the industry is actually shrinking its asset base which hasn’t happened in the last 30 years. In fact, if we could find the data and adjust for all the merger and acquisition activity, we wouldn’t be surprised if this is the first time the energy industry has shrunk its capital base since WWII.
Table 2 – Capital Growth Rate of the Large Publicly Traded Petroleum Companies*

*The above chart calculates the capital growth rate of a composite of major oil companies selected by EIP using annual company reported data sourced from Bloomberg. The composite included the following companies (tickers): XOM, CVX, COP, RDSA LN, BP LN, OXY, EOG, TTE FP, DVN, MRO, APA. Inclusions of other companies may change the information above and EIP’s analysis.
Over the years we have droned on and on about how poor the publicly traded petroleum companies are at reinvesting capital. They always spend too much when things are good and not enough when things are bad which has resulted in long term returns on capital employed in the low single digits. After every spending binge comes the hangover, the taking away of their credit card by the capital markets and promises to do better next time.
But this time ESG shareholders and other stakeholders around the world want the industry to slowly ride off into the sunset by not reinvesting its cash flows. Who knows, maybe those in congress trying to prevent (or tax) company share repurchases will carve out an exception for the energy industry!
It’s an unusual confluence of factors that seem to lead to a lack of response to higher oil and gas prices. While the rest of the world scrambles to add capital to address all the supply chain issues, the petroleum producers are going in the other direction and spending less.
For investors in pipeline companies this might seem to be a bearish signal if the volume of hydrocarbons in need of shipping doesn’t grow. This is another subject we have droned on about as the shale revolution triggered too much investment in pipelines putting pressure on margins, even if those margins are earned under long term contracts. Investors in crude oil pipeline companies did much better in the decade before the shale revolution than in the decade after because of this overbuilding.
Prior to the shale revolution, oil and gas production in the U.S. lower 48 was declining and who in their right mind would build new pipeline capacity in a declining market? But, back then, as now, the dividend yield, inflation escalators in the tariffs and small opportunistic de-bottlenecks all added up to a competitive return.
In our view, successful investing doesn’t result from forecasting the future. It comes from understanding the past while not pretending to know the future. In this case the past is offering a message about value and returns versus growth and reinvestment. Anybody listening?
The above is Energy Income Partner LLC’s (EIP) opinion and such opinions may change without notice or duty to update. The information is based on data obtained from third party publicly available sources that EIP believes to be reliable, but EIP has not independently verified and cannot warrant the accuracy of such information. Past performance is not indicative of future results, which may vary significantly due to changing conditions. Any investment may lose money, including investment principal. EIP Accounts managed for partial periods could have experienced materially less favorable results than those portrayed over the highlighted time horizon. An index is unmanaged, does not incur fees or expenses and an investment cannot be made directly in an Index. References to a particular company or funds are for informational purposes only and are not an offer to purchase or sell or a solicitation to purchase or sell a particular security, company or fund.
XOP is the SPDR S&P Oil and Gas Exploration and Production ETF is an exchange -traded fund incorporated in the USA. The Fund’s objective is to replicate as closely as possible the S&P Oil & Gas Exploration & Production Select Industry Index., an equal-weighted index.
XLK is Technology Select Sector SPDR Fund is an exchange-traded fund incorporated in the USA. The ETF tracks the performance of The Technology Select Sector Index. The ETF holds large and mid-cap technology stocks. Its largest investment allocation is in the United States. The ETF weights the holdings using a market capitalization methodology.
The annual capital growth rate was calculated as: (Σ Capital Expenditures – Σ Depreciation, Depletion, and Amortization + Σ Write-Offs) / Σ Property, Plant & Equipment.
Investors are encouraged to seek their own legal, tax, or other advice before investing.