To paraphrase Michael Douglas in “The American President” (Universal Pictures, 1995), whatever the voter’s problems, most politicians have no interest in solving them. They have interest in two things and two things only; making them afraid of it and telling them who’s to blame for it…. that folks, is how you win elections.
It’s a great line written by a great screen writer (Aaron Sorkin) because it’s true.
Want someone to blame for high energy prices? Blame me. That’s right me and all the other shareholders who have collectively taken away the industry’s credit card following a decade of reckless spending.
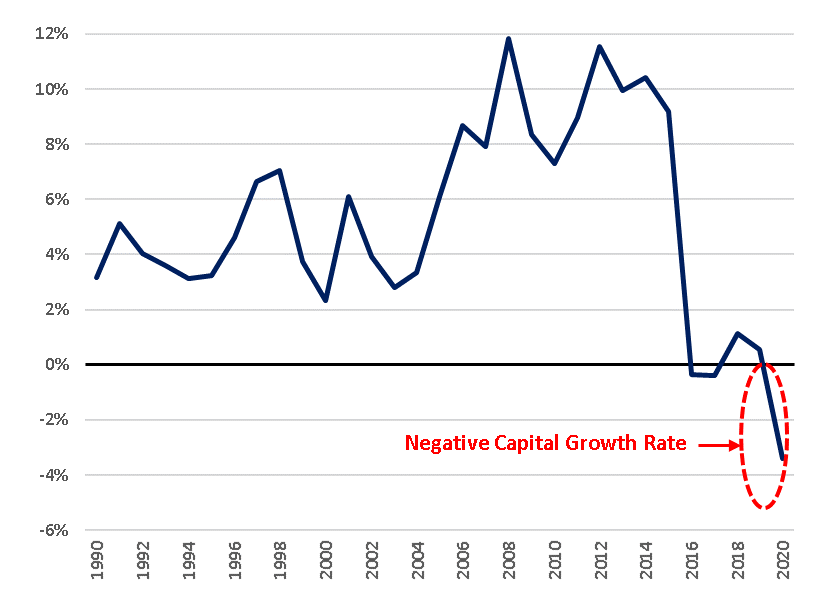
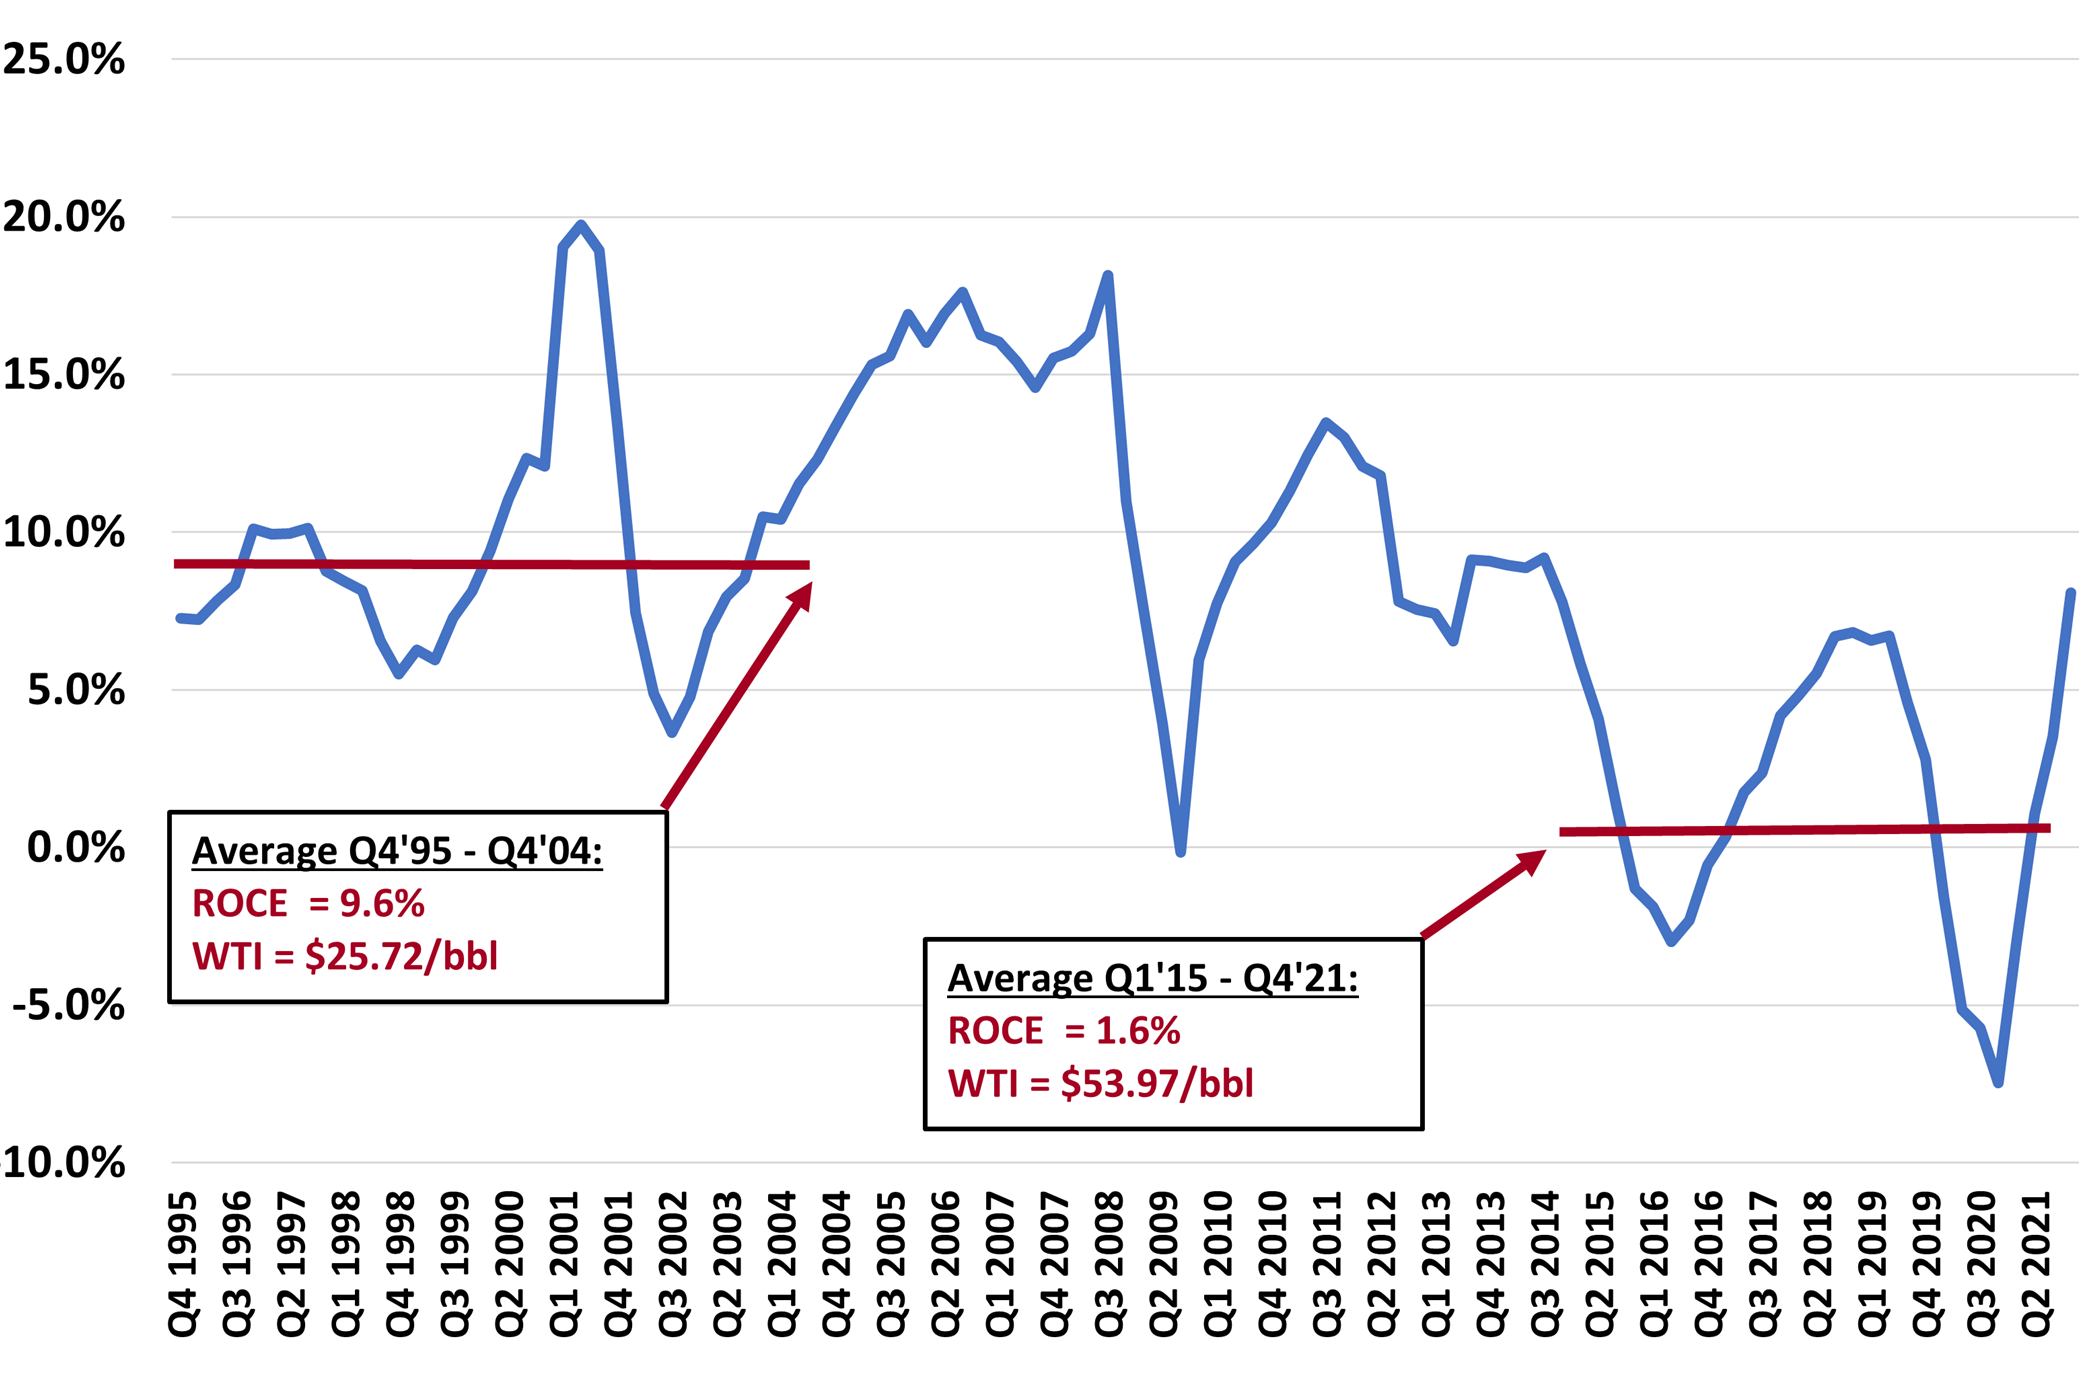
The two graphs below show how excess spending led to a collapse in returns on invested capital which, in turn, has led to a collapse in spending that began in 2015 during the Trump administration. This is not to suggest that Trump had any role to play. Quite the opposite. What presidents say and do is given a lot of ink in the press but have little impact on corporate behavior. Ditto for Biden, which is why he should just stop talking about what he wants the oil companies to do. From a policy perspective he is making a bad situation worse by scaring investors.
Exhibit 1: Capital Growth Rate of the Large Oil & Gas Companies

Source: FactSet, Bloomberg, EIP Estimates. The above chart calculates the capital growth rate of a composite of major oil companies selected by EIP using annual company reported data sourced from Bloomberg. The composite included the following companies (tickers): XOM, CVX, COP, SHEL, BP LN, OXY, EOG, TTE FP, DVN, MRO, APA. Inclusions of other companies may change the information above and EIP’s analysis. Client accounts managed by EIP may own some or all of the companies mentioned above.
Exhibit 2: Return on Capital Employed for the S&P 500 Energy Sector

Source: FactSet, Bloomberg, EIP Estimates. The S&P 500 Energy Sector (S5ENRS) composite includes the following companies (tickers): XOM, CVX, COP, EOG, SLB, PXD, OXY, MPC, KMI, WMB, DVN, VLO, PSX, BKR, HAL, OKE, HES, FANG, CTRA, MRO, APA. Inclusions of other companies may change the information above and EIP’s analysis. The red line and right-hand side of the above chart calculates the return on capital employed (ROCE) of a composite of major oil companies selected by EIP using annual company reported data sourced from Bloomberg. ROCE = (Earnings plus after-tax interest) / (Total Assets minus Current Liabilities). Client accounts managed by EIP may own some or all of the companies mentioned above.
Yes, the oil and gas companies are giving the lion’s share of cash flow back to the people it belongs to, the shareholders. These revolting shareholders have taken back control over the capital allocation process. See what an activist shareholder, Engine No. 1, did to change the ExxonMobil board last year holding only about 0.03% of the shares. Some characterize this as bowing to ESG and climate activists. It’s not. Its shareholders demanding return OF capital rather than broken promises of returns ON capital.
If the public has an interest in more production of oil and gas for inflationary and national security reasons, then policy makers should figure out how to incentivize private investors (who own virtually all the assets of the oil and gas industry) to loosen the purse strings. We control these assets because we own them, not the management teams. We hire them to run our assets and allocate our capital. And right now, I want more of that capital returned until someone can convince me otherwise.
The information provided above is based on data obtained from third party publicly available sources that EIP believes to be reliable, but EIP has not independently verified and cannot warrant the accuracy of such information. In providing the information, EIP has made several assumptions that if changed, materially affect the information and conclusions provided. This information is based upon EIP’s opinion which may change at any time and without notice.