The Radical Changes to the S&P Global Clean Energy Index (the “Index”) No One is Talking About
Key Takeaways:
- Index is now 81 companies up from 30.*
- Utilities now 26% of Index up from 5%.*
- Renewable power generation dropped from 43% to 19% of Index.*
- Index now has much larger market cap, more daily trading volume and a lower P/E.*
- Inflows into ETFs that track the Index will have much smaller impact on prices.
- Exposure to cyclical margin-based earnings is still high as equipment manufacturers are nearly unchanged at 40% of Index.*
*Source: S&P, Bloomberg, EIP estimates
Why it Matters:
The S&P Global Clean Energy Index is part of S&P Dow Jones’ Thematic ESG Indices which provide targeted exposures to specific industry and ESG themes. This Index is currently being tracked by a number of ETFs (ICLN US, INRG LN, and ZCLN CN) with total assets under management of ~US $11 billion as of May 20, 2021.
EIP’s Take
Changes like this are consistent with the broadening, deepening and maturing of investors’ understanding of the energy transition which is so much more than wind, solar fuel cells and batteries. EIP believes electric power and gas network operators play a critical role integrating new supply sources and creating a more dispersed, intelligent, cheaper and cleaner energy system. They grow by investing in this integration without taking technological or price risk on these new technologies.
The Index Before and After:
The effect on sector allocation, diversification valuation and carbon metrics are shown in the following table:

*Companies in the index are classified by EIP according to Bloomberg BICS Level4 and BICS Level 5 classifications, aggregated into fewer categories.
Source: Bloomberg, EIP. This is provided to show the change in the weightings and components of Standard & Poor’s Global Clean Energy Index. EIP notes that there may be tracking error between the index and products (ICLN) that track them and therefore may not always be an appropriate proxy for such index. Information provided is not intended as a solicitation to purchase or sell any of the products discussed in the chart.
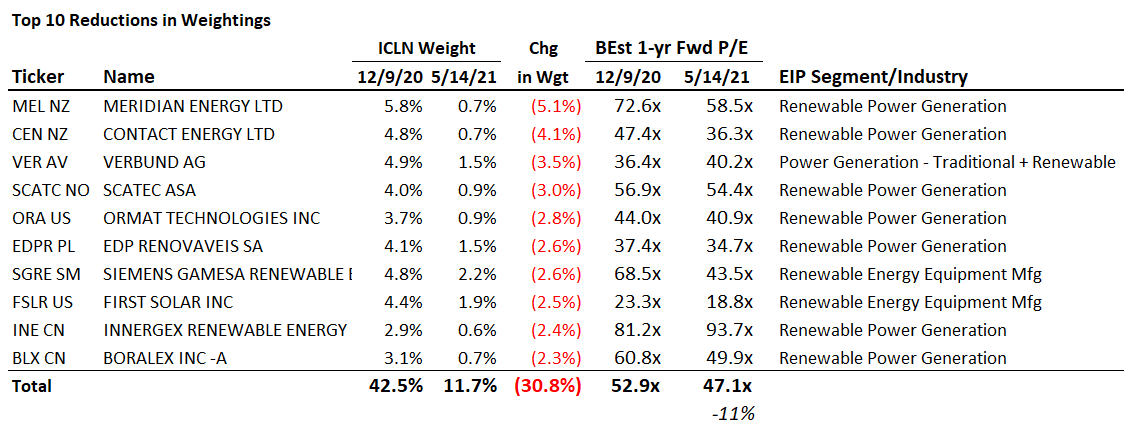
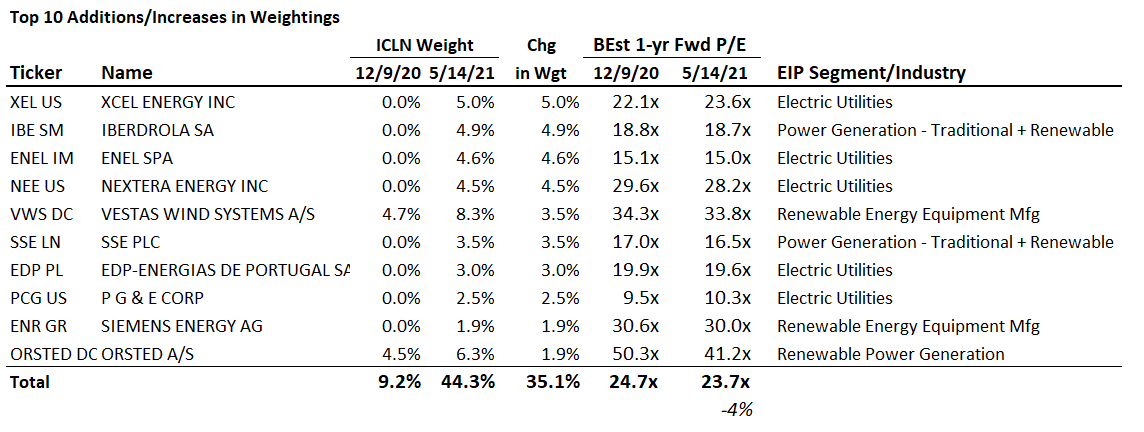
Top 10 Increases and Decreases in Index Weight

 Why the Change?
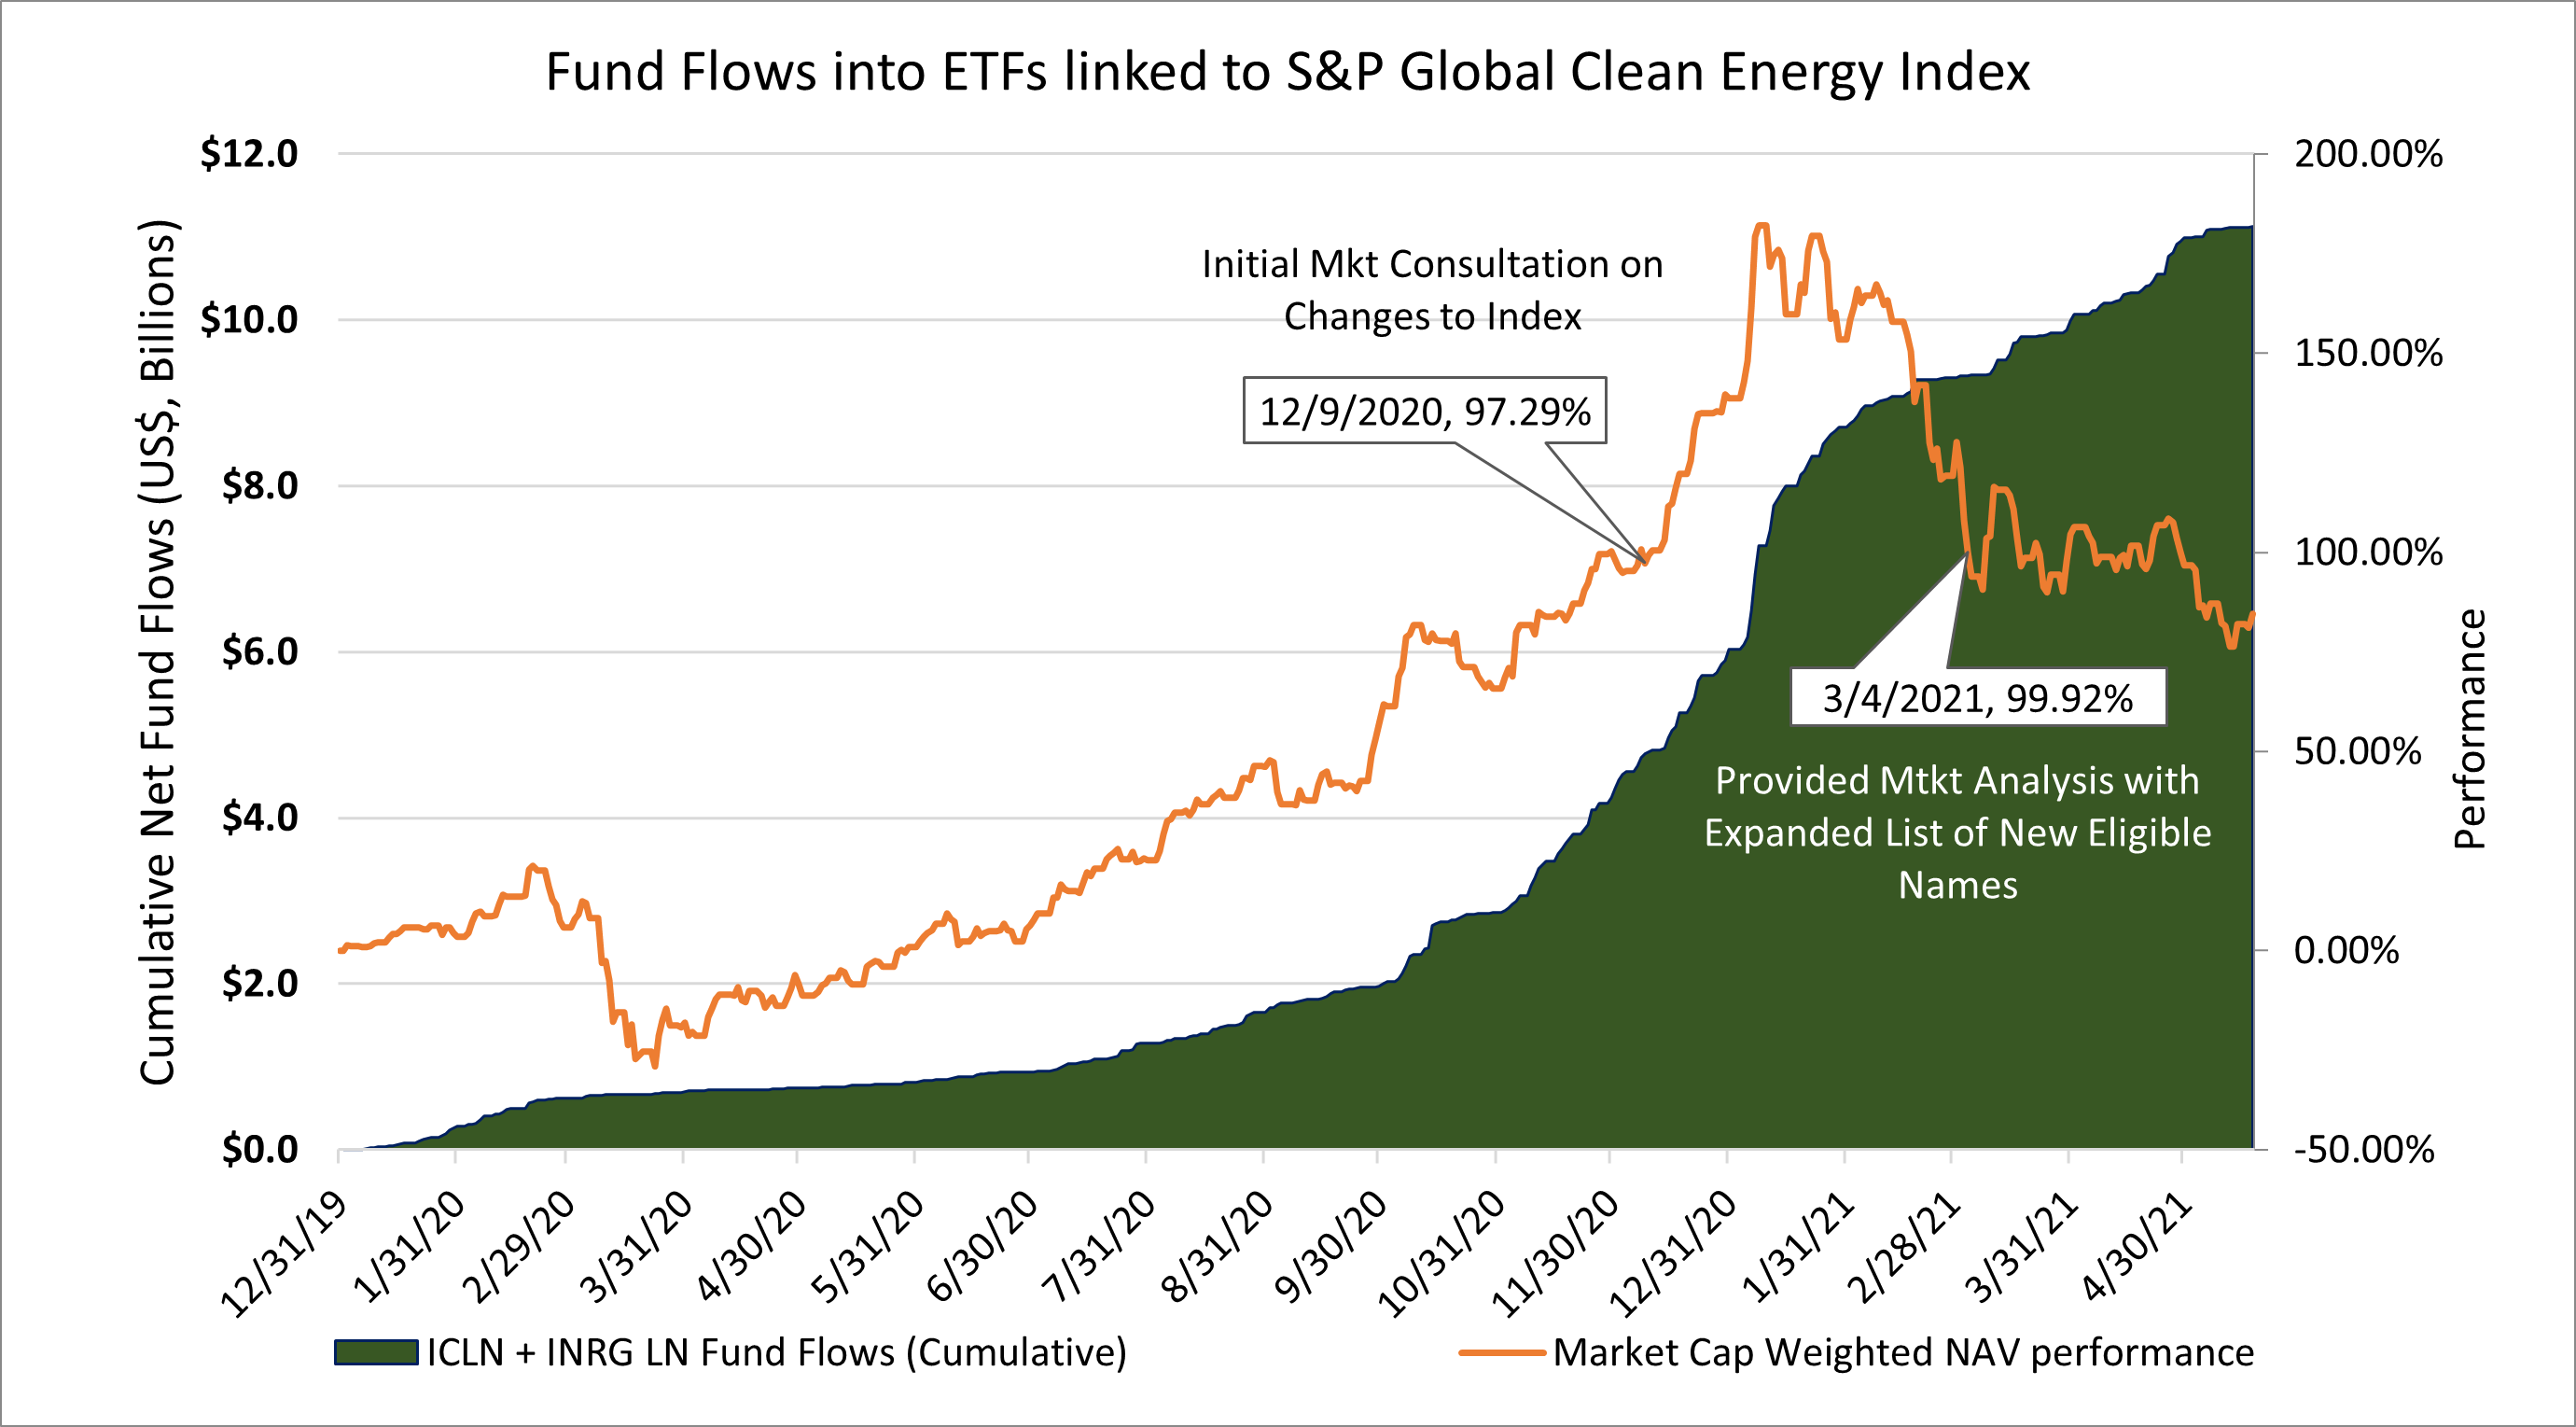
The chart below sums it up. Nearly $8.5 billion in net fund flows occurred from the beginning of September in 2020 through the index re-constitution on April 2nd. These inflows represented a significant portion of the average daily trading volume of the Index constituents prior to these inflows, thus in our opinion, driving performance of the Index and those ETFs that track it. As the funds that follow this index grew liquidity constraints became a larger concern.
 Source: Bloomberg, EIP. Market cap weighted NAV performance consists of two ETFs ICLN and INRG LN. These are the only two ETFs linked to S&P Global Clean Energy Index as of 1/1/2020. This chart is to show the inflows into ETFs that track the Index and performance of two of the ETFs. It is not intended as a solicitation to purchase or sell any of the products discussed in the chart.
The Information provided in this article is believed to be accurate as of the date above. EIP reserves the right to update, modify or change information without notice. Any statements of opinion are EIP’s opinion and should not be relied upon as a prediction of any future event. The information is based on data obtained from third party publicly available sources that EIP believes to be reliable but EIP has not independently verified and cannot warrant the accuracy of such information. Investors are encouraged to seek their own legal, tax, or other advice before investing.