Key Takeaways
- Most oil demand forecasts anticipate global oil demand to stubbornly grow over the next decade despite more and more government polices to encourage the sale of electric vehicles (EVs), like Biden’s August 5th Executive Order targeting 50% of new car sales to be zero emissions by 2030.
- Why the disconnect? Three reasons:
1) The slow rate of fleet turnover (about 4% annually[1]);
2) Continued global growth in miles driven and the on-road fleet, the vast majority[2] of which is still powered by internal combustion engines (ICE);
3) Only about 27% of oil is used for passenger vehicles and 17% for commercial vehicles[3]. The rest of oil demand (for off-road transport, industry, plastics and fibers, space heating, etc.) is still forecast to remain flat or rise with global economic growth.
- Renewables have little impact here as only 3% of oil demand is for power generation[4].
- With this in mind, we dusted off our fleet turnover model and then kept adjusting the inputs to see what it would take to get oil demand to be lower in ten years. But we found no set of reasonable assumptions that would bend the curve fast enough.
- The primary inputs are the portion of new vehicles sold that are electric, the fleet turnover rate and the global growth rate in miles driven.
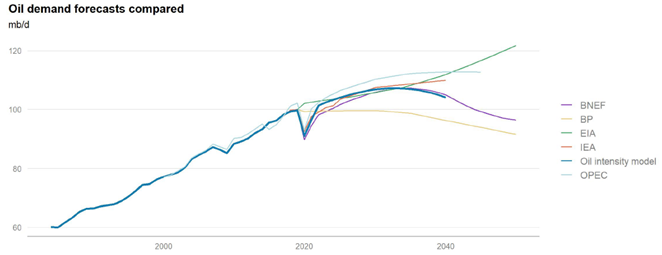
Exhibit 1 comes from our friends at Morgan Stanley and lays out the oil demand forecasts from some of the leading sources. Except for BP’s forecast, all are predicting higher oil demand 20 years from now versus pre-COVID levels.
Exhibit 1: Oil Demand Forecasted to Grow

Source: Morgan Stanley Research’s June 1 2021 Report: “Oil, OPEC and ESG – Raising Long-Term Oil Price Forecasts”, by Martijn Rats, CFA and Amy Sergeant, CFA.. Note: Oil intensity model line is Morgan Stanley’s forecast.
Alternate Reality
While we cannot speak to how these forecasts are derived, we know that changes in the capital stock that use energy are an important factor, and none more important than transportation since we are now seeing alternatives to petroleum-powered vehicles.
So, in our attempt to bend the oil demand curve, we made three extreme assumptions to see if there was any scenario that would result in lower oil demand in ten years.
First, we ignored all the friction that stands in the way of getting to 50% of global new vehicle sales being EV’s by 2030 and 100% by 2050. We are not modelling consumer behavior based on costs, range anxiety, charging availability, etc. We are just plugging in faster adoption rates than anyone is forecasting.
Second, we assumed the same EV (or fuel cell) penetration for commercial vehicles (light-, medium-, and heavy-duty trucks) as for passenger vehicles. We even assumed rail, shipping and aviation followed a similar decline in use of petroleum as commercial vehicles, ignoring that better-suited technologies like fuel cells and hydrogen, seem farther away from adoption.
Third, we cut the rate of growth in miles driven and the vehicles required to 2%, although the five years prior to COVID experienced ~4% annual growth globally[5]. Since this new demand is still being met primarily with ICEs, cutting growth to 2% drives lower oil demand growth.
Combined, these three assumptions constitute an alternate reality. But let’s see how they play out in the model.
Fleet Turnover
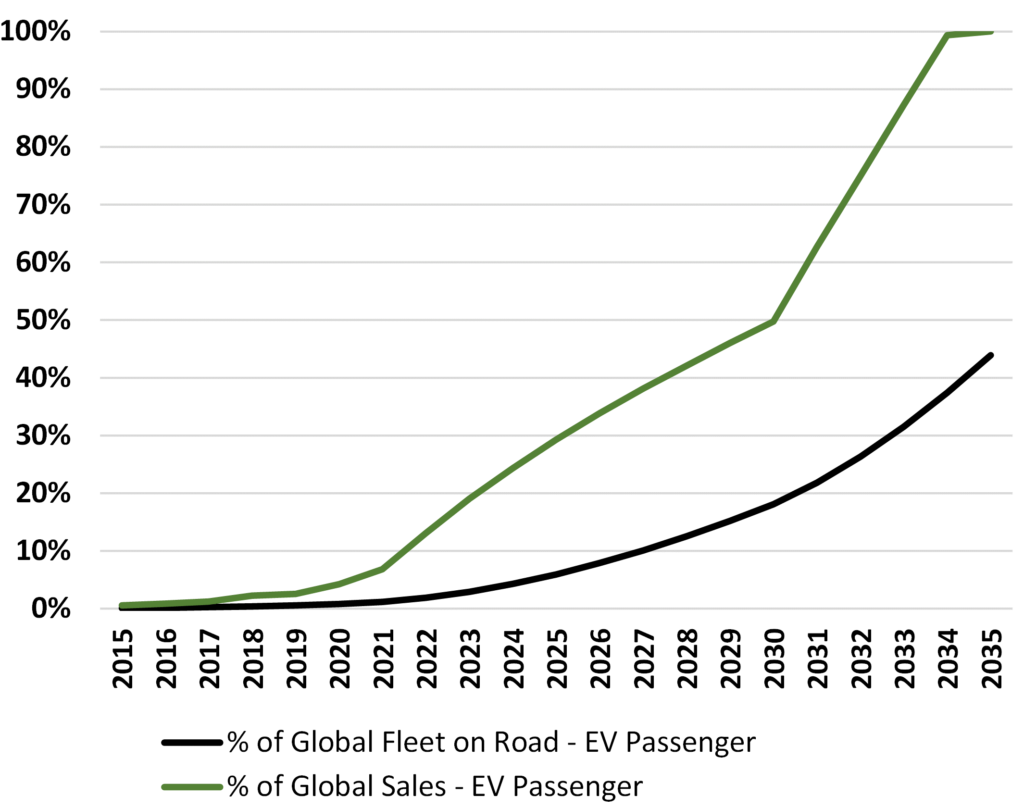
As with Biden’s executive order, most of the discussion about EVs focuses on the portion of new car sales made up of EVs. But the average reader has little idea that the fleet turns over at only about 4% per year, reflecting a 15-20-year life for most vehicles. In part, this is because the average reader doesn’t know what happens to his or her car after it is traded in for a new car. Exhibit 2 shows how the on-road fleet penetration of EVs (Black-line) lags the portion of new cars sales made up of EVs (Green-line) using the extremely bullish EV adoption rate inputs to our model.
Exhibit 2: EV Adoption: New Passenger Vehicles Sold vs On-Road Fleet

Source: EIP, Bloomberg NEF.
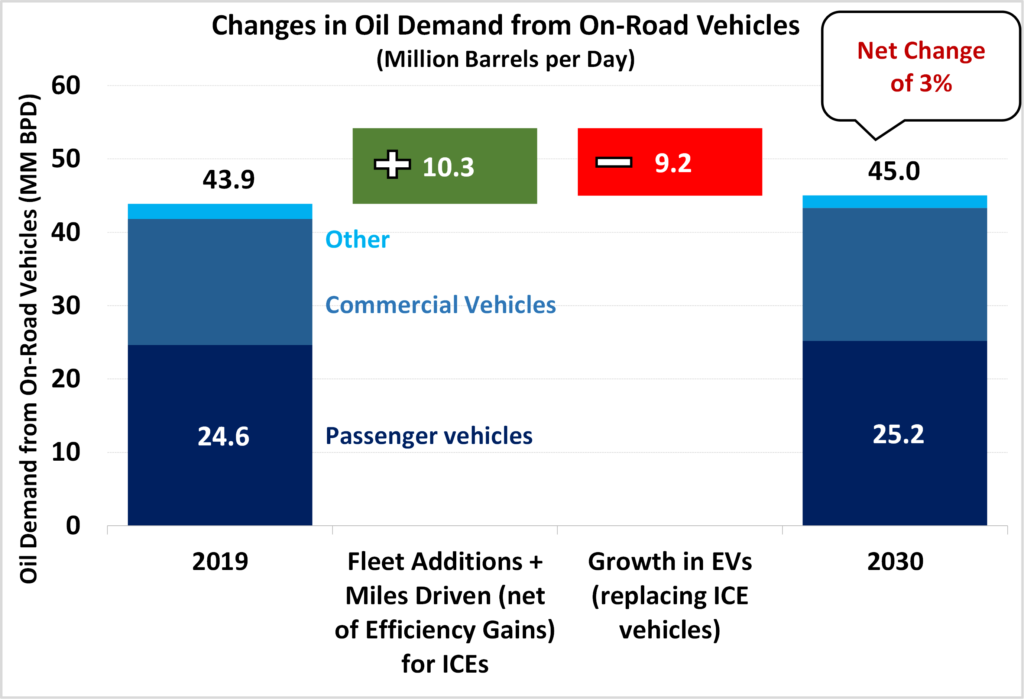
While new EVs work their way slowly into the on-road fleet, demand for on-road passenger and commercial vehicles continues to rise globally. Prior to COVID that growth was ~4% annually, but even if we slash that growth rate to 2% the resulting oil demand from on-road vehicles in 2030 still grows by ~10 million bbls/day, or ~10% of 2019 total oil demand. This can be seen in Exhibit 3, where this growth in the existing fleet is roughly offset by the extremely bullish assumptions we plugged into the model for EV sales.
Exhibit 3: Changes in Transportation Fuel Demand From Rapid Adoption of EVs

Source: EIP, BP’s Statistical Review of World Energy 2020, Bloomberg NEF. Note EIP used 2019 as a base to remove the near-term impacts of COVID.
Bear in mind, we are modelling the impact of EVs on transport fuels which represents roughly half of crude oil demand. The other half – made up of industrial fuels and lubricants, petrochemicals and fibers, asphalt, space heating, etc. – is still expected to grow as there are no ready economic substitutes.
The result of this exercise is that even with these extremely bullish model inputs (i.e. high EV penetration and low fleet size growth), we still get oil demand in 2030 approximately equal to that in 2019.
Of course, running the model out further shows that the transition to EVs starts to have a material impact on oil demand by 2040 and beyond. But a lot can happen between now and then that changes the inputs to this arithmetic.
Final Thoughts
It has always been our view that EV adoption, while accelerated by government policies, will happen for the same reasons that drive adoption of all new products: cost and performance. In our view, these factors, which can be influenced by government policies and R&D, will likely lead to an all-electric transport system someday. But, as this modelling exercise shows, even the most extreme bullish assumptions regarding a shift in new vehicle sales – passenger as well as commercial – still cannot bend the crude oil demand trajectory within the next ten years.
This exercise is also useful in that it identifies the levers policy makers will have to pull if they want to drive a faster transition. Perhaps a cash-for-clunkers program could accelerate fleet turnover, but extending incentives beyond passenger vehicles to commercial vehicles and off-road transport would also be necessary. And if policy makers were to pull these levers, the EV industry would need to make massive investments in capacity to meet the extra demand (which in the near term is a large constraint) and electric utilities would need to accelerate their growth in capacity to produce and deliver electricity.
That global crude oil demand is not likely to fall – and may even rise – over the next ten years is the source of endless questions from our investors yet it has no practical impact on our portfolio. Why? Because crude oil logistics is a very small part of our portfolio, and the profitability of those logistic assets are driven by the cost position of the oil fields at the supply end of the system and the refineries, and the demand end of the system combined with competition from other logistic assets.
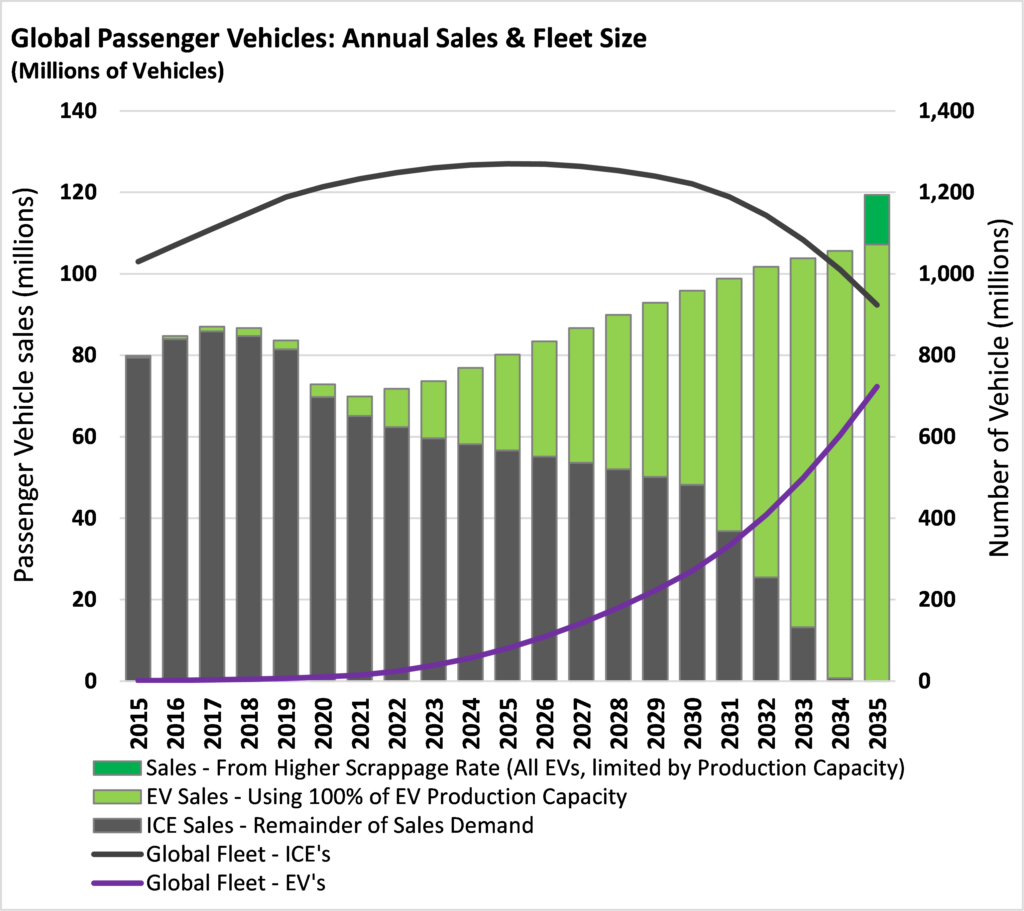
Exhibit 4 brings these different factors together. The bars show how in our model new car sales would shift from conventional ICEs (Gray) to EVs (Green), bifurcated to show the portions to meet scrappage and growth of the fleet. These changes in new vehicles sold work their way into the global fleet only gradually as shown by the two lines. The Black line at the top is the number of conventional ICE vehicles on the road, which continues to grow for another 5 years or so before beginning to decline. The Purple curve at the bottom is the number of EVs on the road, which starts off slow and then accelerates.
The Dark Green part of the bar on the right hints at EV production constraints that would be triggered by a higher scrappage rate. We discuss this and more detail on how the model works in our deep dive located here!
Exhibit 4: Annual Global Passenger Vehicle Sales & Fleet Size Mix Over Forecast Period
[1] By fleet turnover, we are referring to the scrappage rate. This is calculated as the annual sales of new vehicles minus the Y-o-Y change in vehicle fleet size. For the past five years, we used Bloomberg NEF data to calculate an average of approximately 4% per year.
[2] EV’s in 2020 represented just 4% of sales and 1% of fleet size globally for passenger and commercial vehicles, per Bloomberg NEF.
[3] Source: BP’s Statistical Review of World Energy 2020, Bloomberg NEF.
[4] Ibid.
[5] Source: Bloomberg NEF.
The Information provided in this article is believed to be accurate as of the date above. EIP reserves the right to update, modify or change information without notice. Any statements of opinion are EIP’s opinion and should not be relied upon as a prediction of any future event. The information is based on data obtained from third party publicly available sources that EIP believes to be reliable but EIP has not independently verified and cannot warrant the accuracy of such information. Investors are encouraged to seek their own legal, tax, or other advice before investing.
