Two of the best annual reports on global energy supply and demand came out over the last two weeks: The International Energy Agency (IEA) Report on capital spending and the bp Statistical Review of World Energy 2022 (BP Report).
Spoiler Alert: Demand is up, and supply is lagging.
The pandemic introduced a lot of uncertainty about whether oil and gas demand trends were deviating from their historical norms due to the growth of alternative energy sources. The BP Report shows this view to be completely wrong. More on demand later. Let’s start with the supply side.
Supply Side
While many businesses are currently experiencing supply chain issues due to the pandemic, energy is different because oil and gas production capacity began deteriorating seven years ago due to a 50% decline in capital spending while the rest of the global economy was humming along fine. This decline resulted from falling oil and gas prices triggered by massive overinvestment during the previous ten years, especially in U.S. shale. The IEA Report gives us an early look at whether industry capital spending is rising enough to catch up to recovering demand. [1]
Second spoiler alert: It’s not.
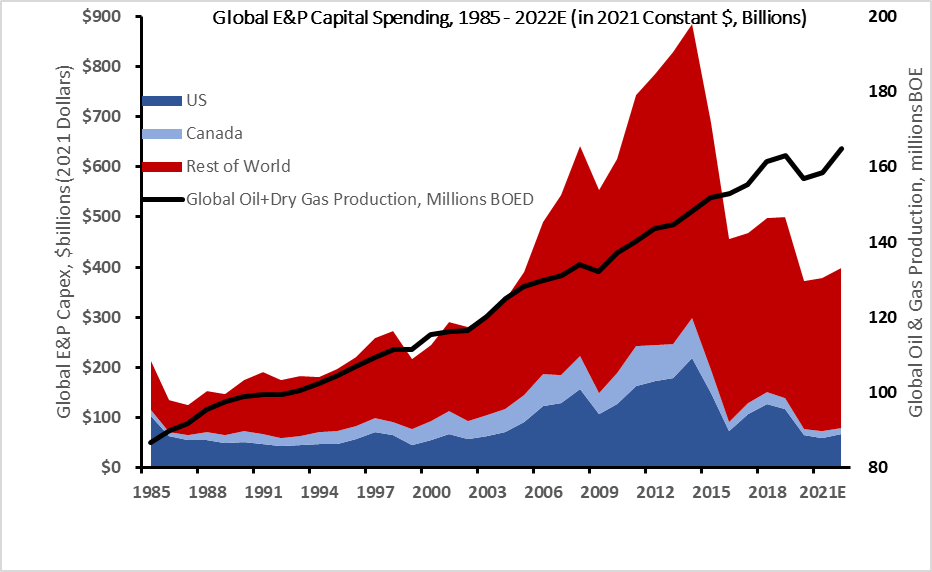
Let’s put the recent IEA Report into historical perspective and review and update a graph we have been showing for over a year. Exhibit 1 shows global oil and gas capital investment.
Exhibit 1 – Global Oil and Gas Capital Spending
Sources: Evercore ISI Research (using a compilation of Company Data, Salomon Brothers, Salomon Smith Barney, Lehman Brothers, Barclays Capital, and Evercore ISI Research estimates), U.S. Bureau of Economic Analysis, EIA, EIP estimates. BOED = Barrels of Oil Equivalent per Day
While capital spending has been cut in half from its 2013 peak, it is still well above where it was twenty years ago. But world oil and gas production and the capital needed to offset natural field declines have increased substantially over the last twenty years. Production of oil and gas is up nearly 100% from 2001 to 2021 yet capital spending is up only 30% on an inflation adjusted basis. This disconnect implies that capital spending dropped below what is needed to grow capacity. Result: Capacity shrank.
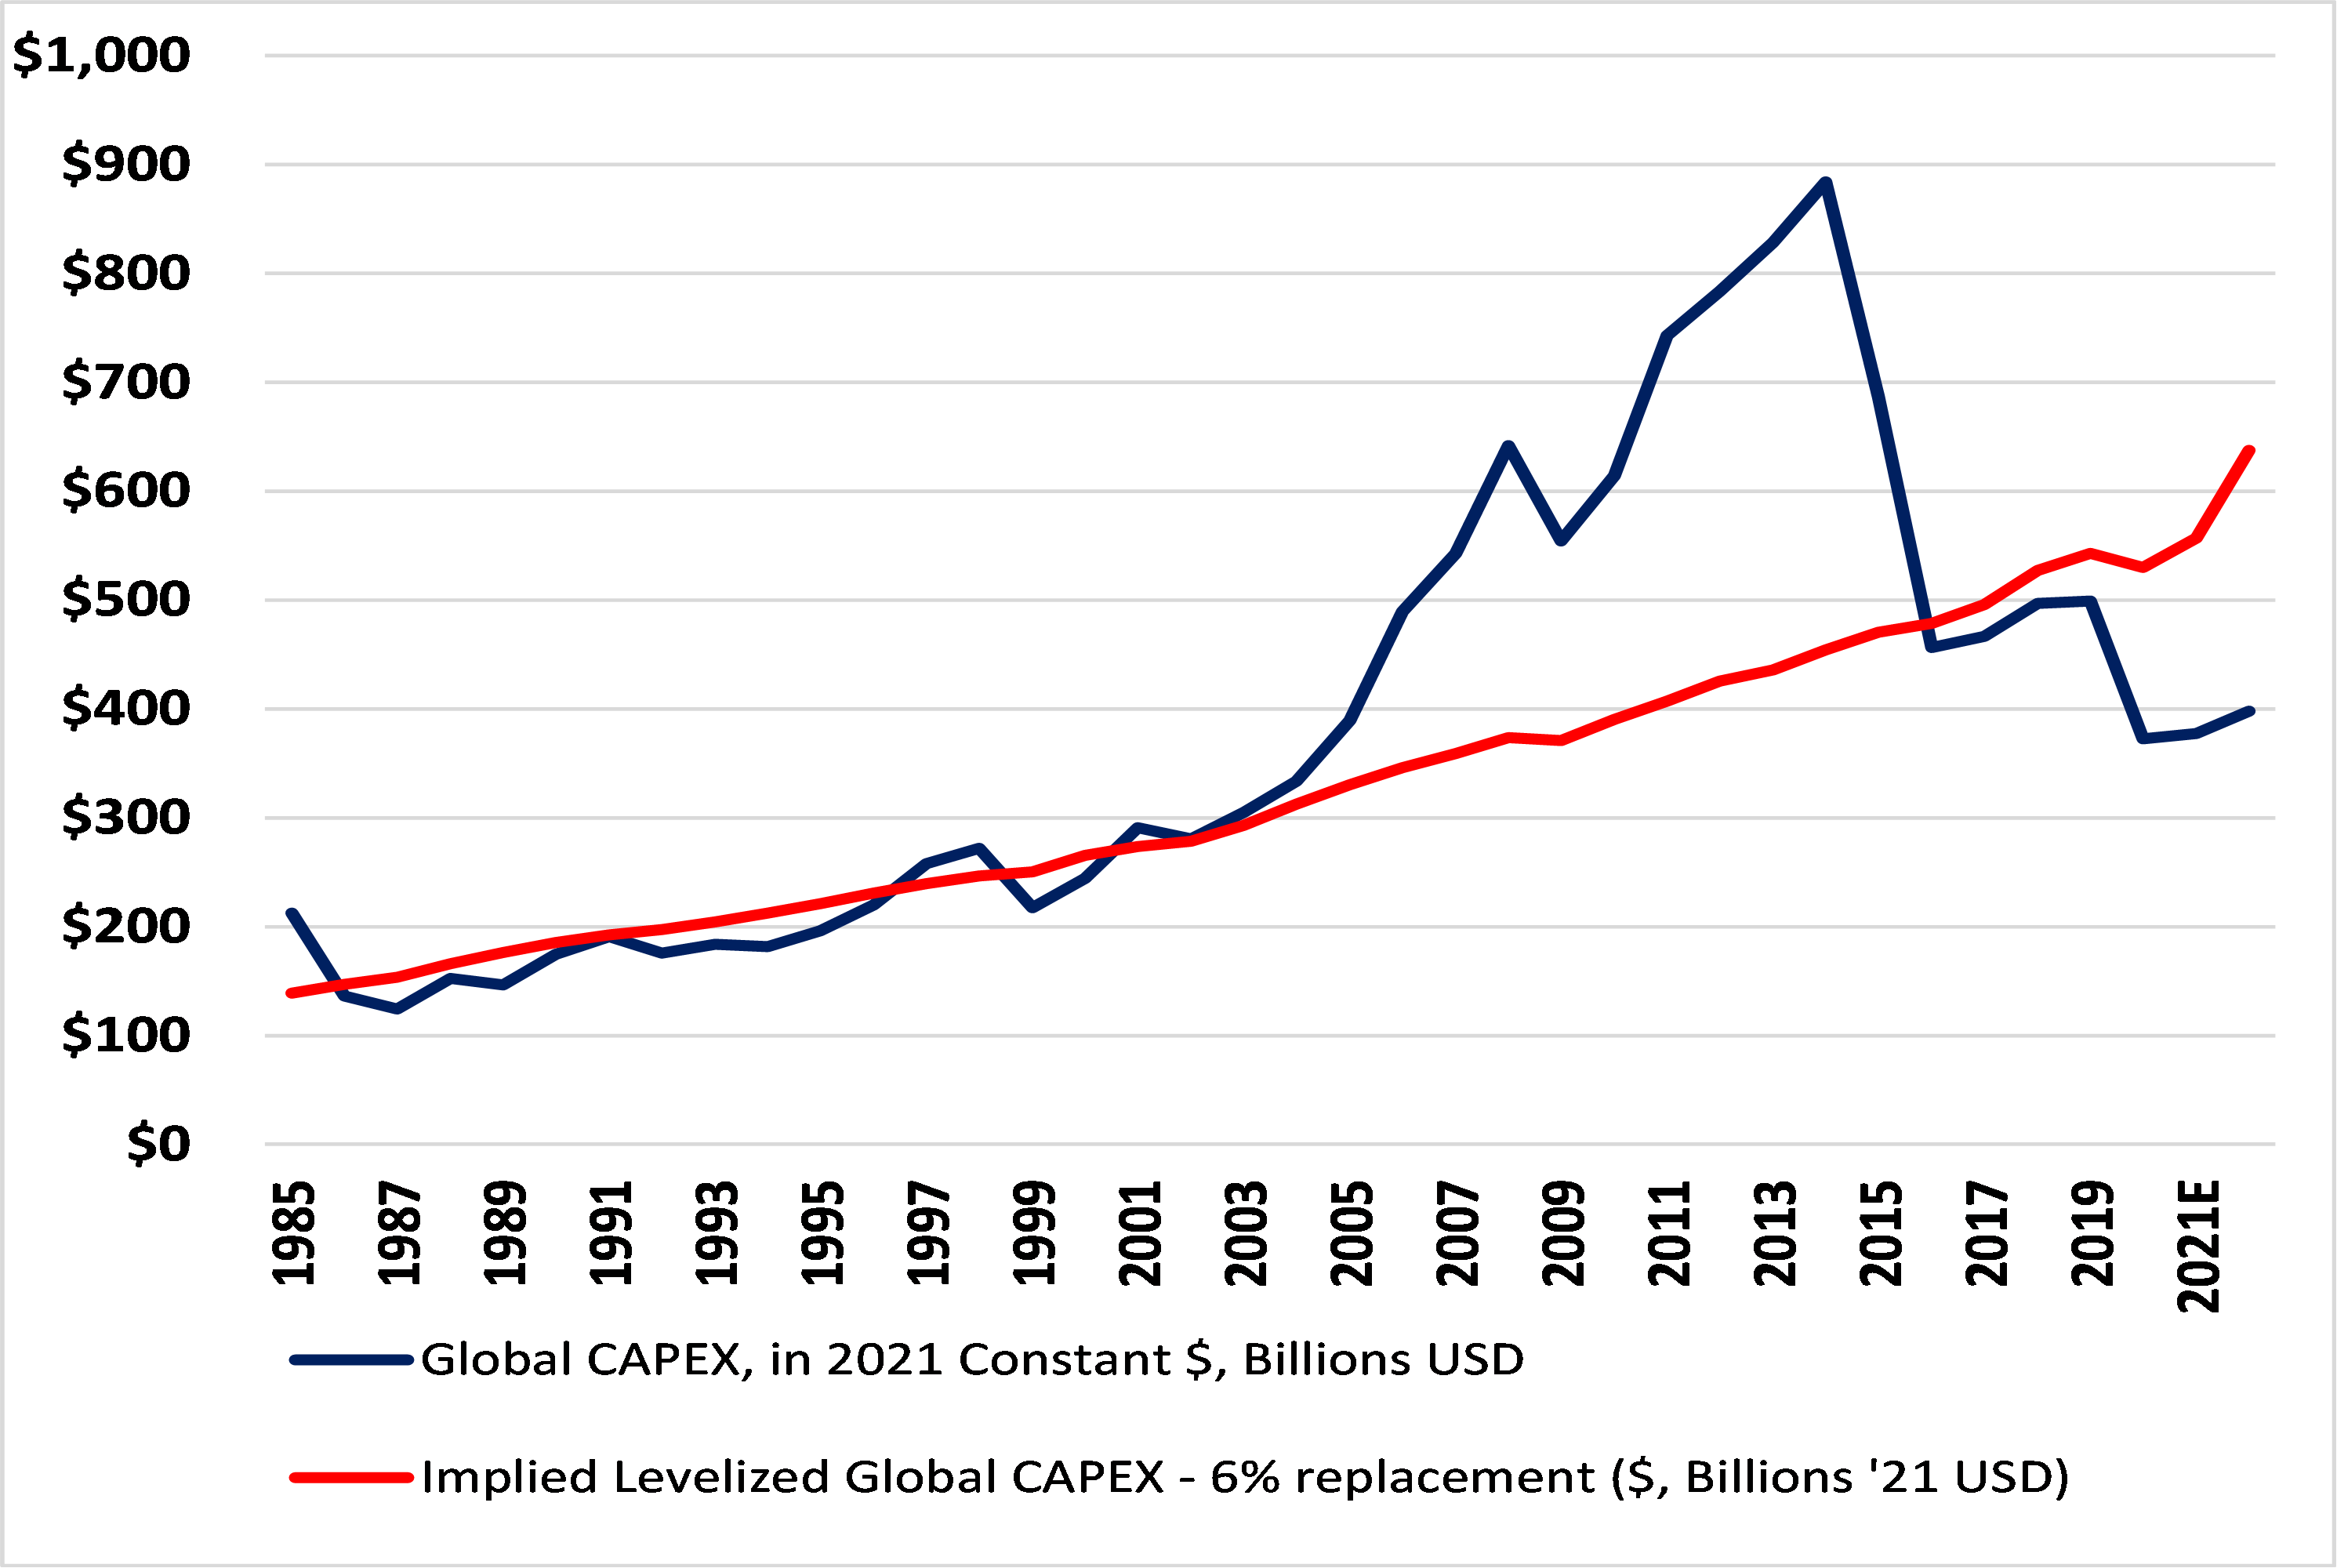
Exhibit 2 takes a stab at assessing and quantifying this shortfall. The red line is a rough estimate of the dollars needed to maintain sufficient production capacity using the average actual costs incurred, an assumed annual production decline rate for global oil and gas fields of 6% and historic growth rates for oil and gas demand which have averaged 1.8% annually (1.4% for oil and 2.3% for natural gas) since 1985. The decline rate is important because oil and gas is an extractive industry that requires continued investment to replace depleted reserves. It also means that the industry must invest the equivalent of 7.8% to its production capacity every year; 6% to replace declines and 1.8% to satisfy growth.
In other words, about three-quarters of the capital spent each year is needed just to maintain production capacity by offsetting natural field declines.
People in the industry may disagree about the global decline rate, but the graph shows that it fits pretty well with actual spending until the industry went on a spending spree between 2005 and 2014[2]. That spending spree, in our opinion, led to too much capacity and a collapse in oil prices which in turn led to a 50% decline in capital spending to levels below what is needed to maintain capacity.
Exhibit 2 – Global Oil and Gas Capital Spending vs Estimated Sustaining Capital
Sources: Evercore ISI Research (using a compilation of Company Data, Salomon Brothers, Salomon Smith Barney, Lehman Brothers, Barclays Capital, and Evercore ISI Research estimates), U.S. Bureau of Economic Analysis, EIA, EIP estimates.
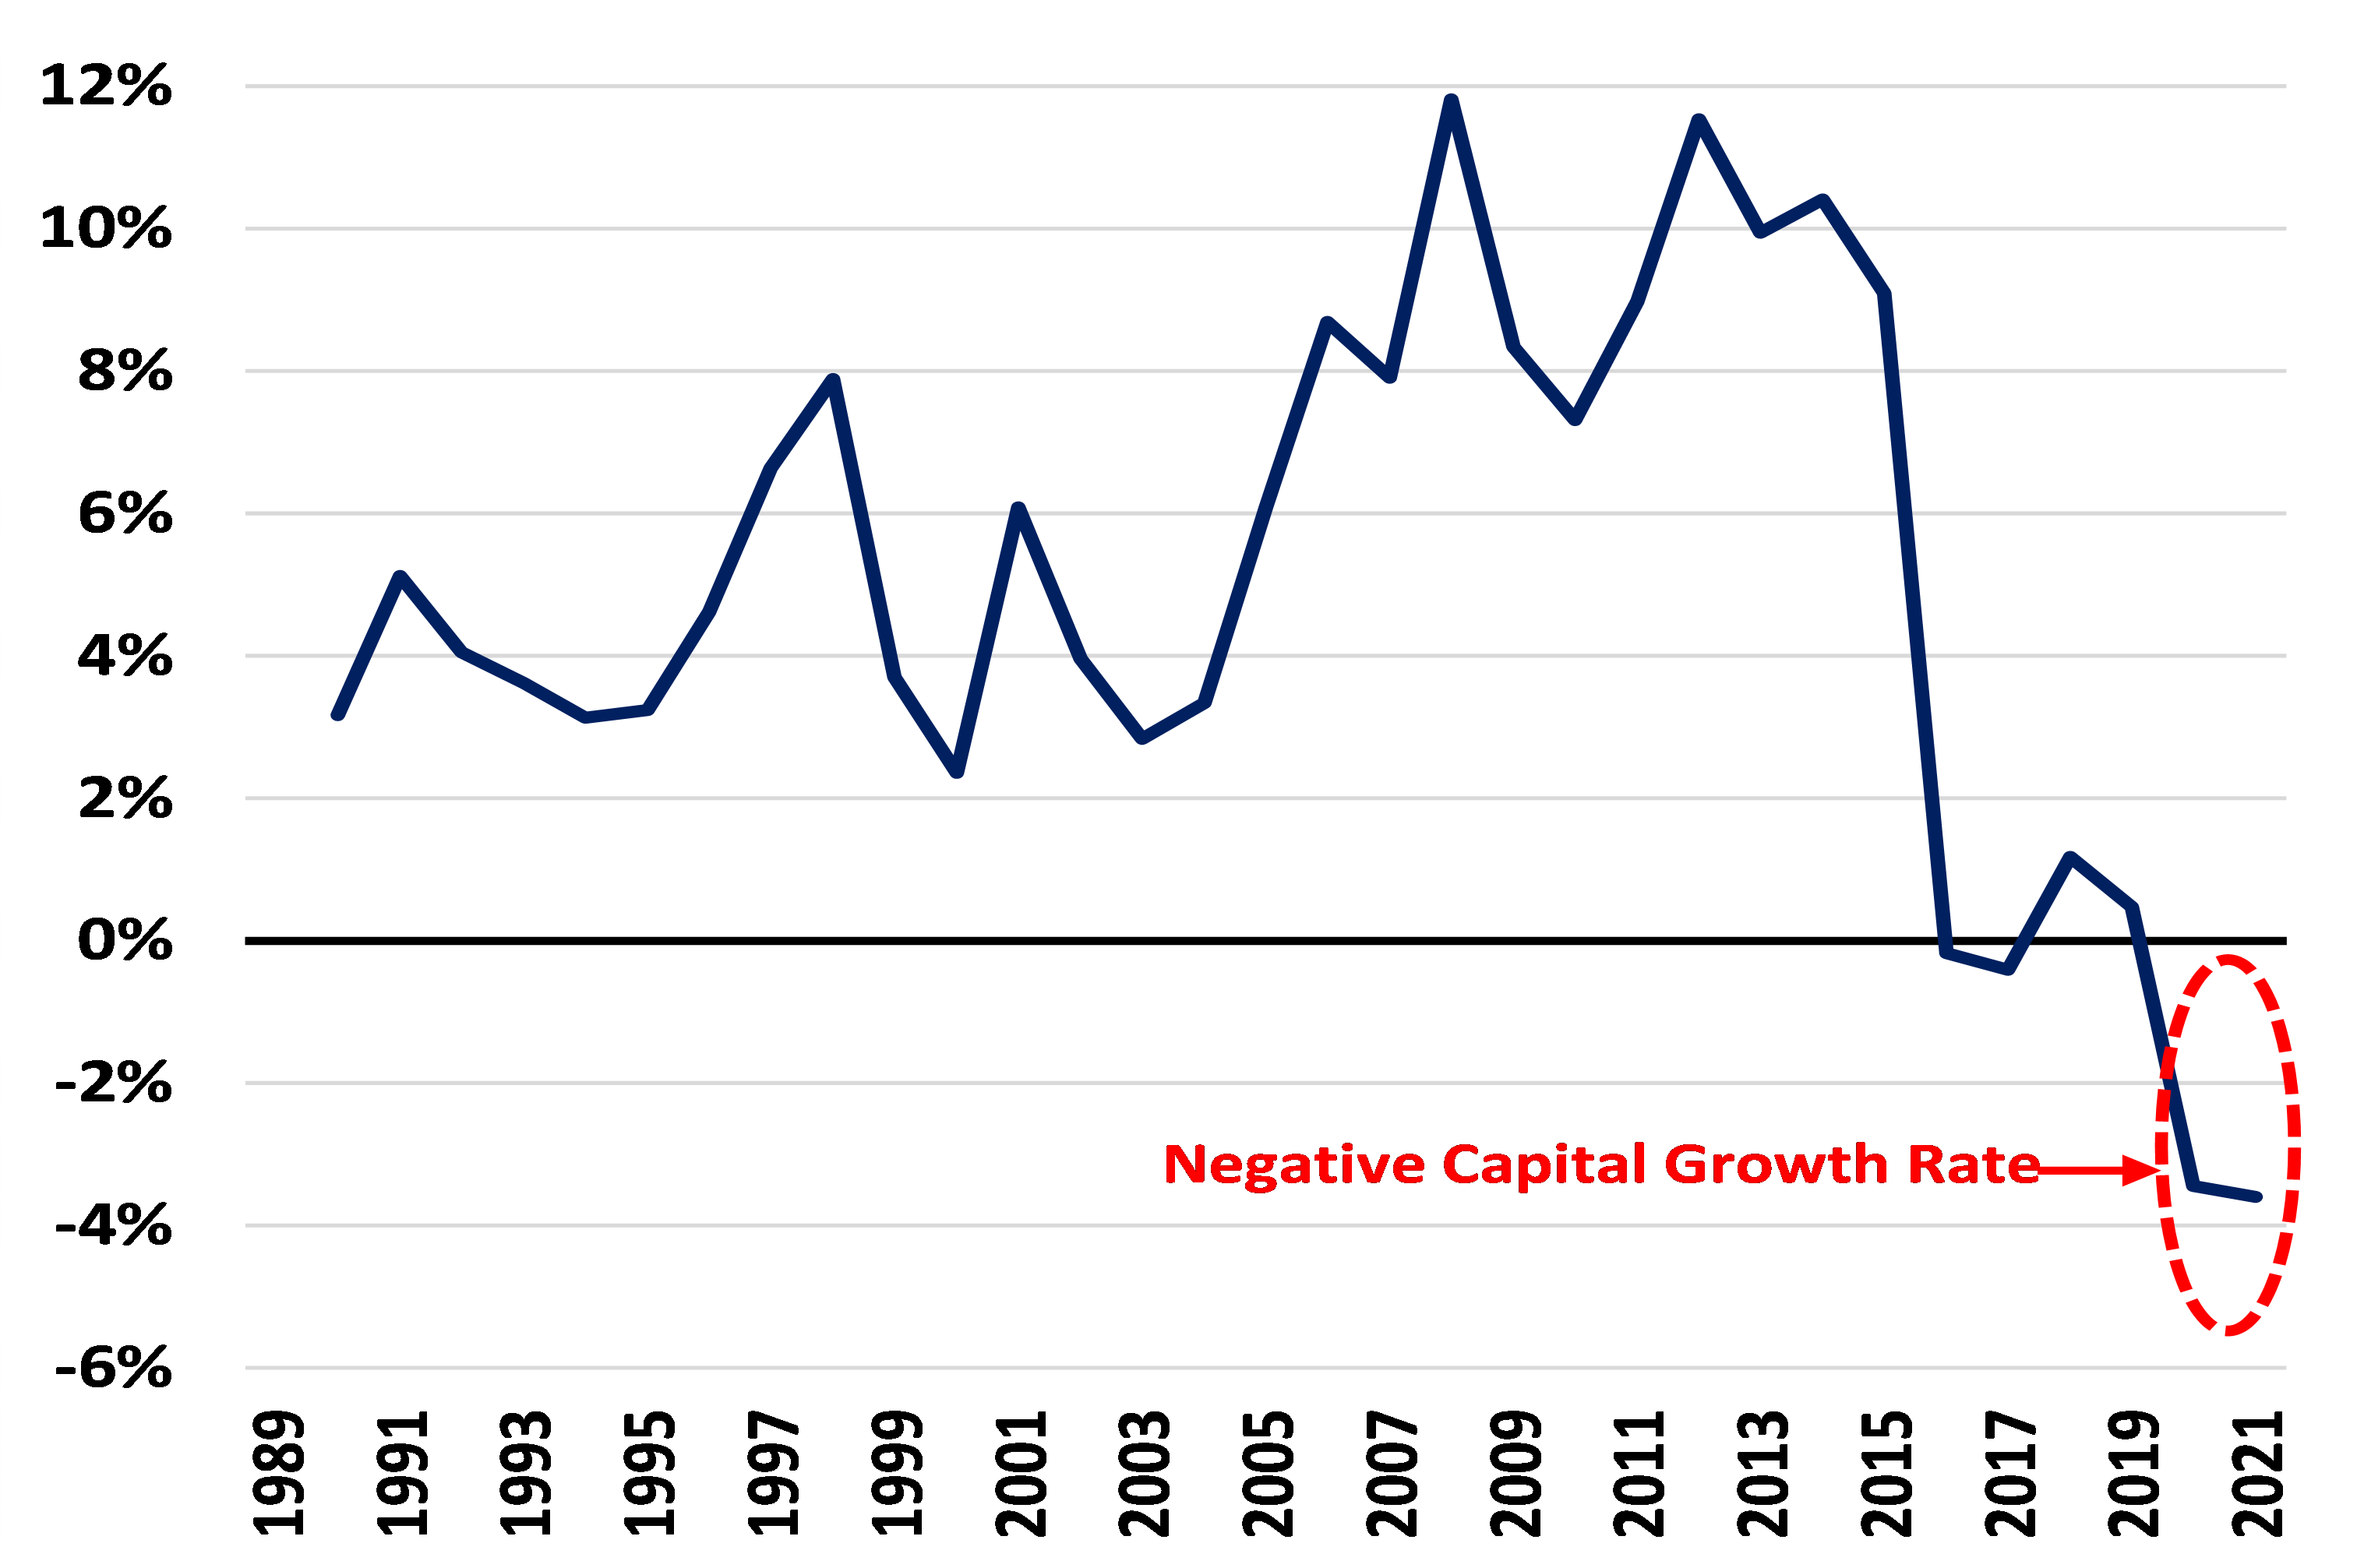
Exhibit 3, which we have shown before but have updated with more recent data, approaches this issue by looking at the financials of the large publicly traded petroleum companies, which are a useful proxy for industry trends. While representing about 13% of world production[3], they are partners with many private and national oil companies in projects that account for a much larger portion of global supply. In this graph, we are subtracting depreciation, depletion, and amortization (DD&A) from capital spending and dividing the result by the asset base. This results in the capital (or capacity) growth rate.
Exhibit 3 – Capital Growth Rate for the Major Oil Companies
Source: FactSet, Bloomberg, EIP Estimates
The above chart calculates the capital growth rate of a composite of major oil companies selected by EIP using annual company reported data sourced from Bloomberg. The composite included the following companies (tickers): XOM, CVX, COP, SHEL US, BP LN, OXY, EOG, TTE FP, DVN, MRO, APA. Inclusions of other companies may change the information above and EIP’s analysis.
The negative capital growth shown in Exhibit 3 matches the shortfall of global capital spending vs estimated sustaining capital in Exhibit 2. The IEA Report is also helpful here showing that non-publicly traded private companies and national oil companies have experienced similar capital spending declines as the publicly trade ones, with the exception of the national oil companies in the Middle East.
But wait, it gets worse. Since the shale revolution in the U.S. the average decline rate for global oil and gas production has accelerated. The shale revolution happened because innovations in horizontal completions and fracturing of the reservoir rock allowed for a much faster capture of the oil and gas, which, because of the time value of money, made these wells more profitable. But the flip side of the profit coin is a faster decline rate when drilling stops.
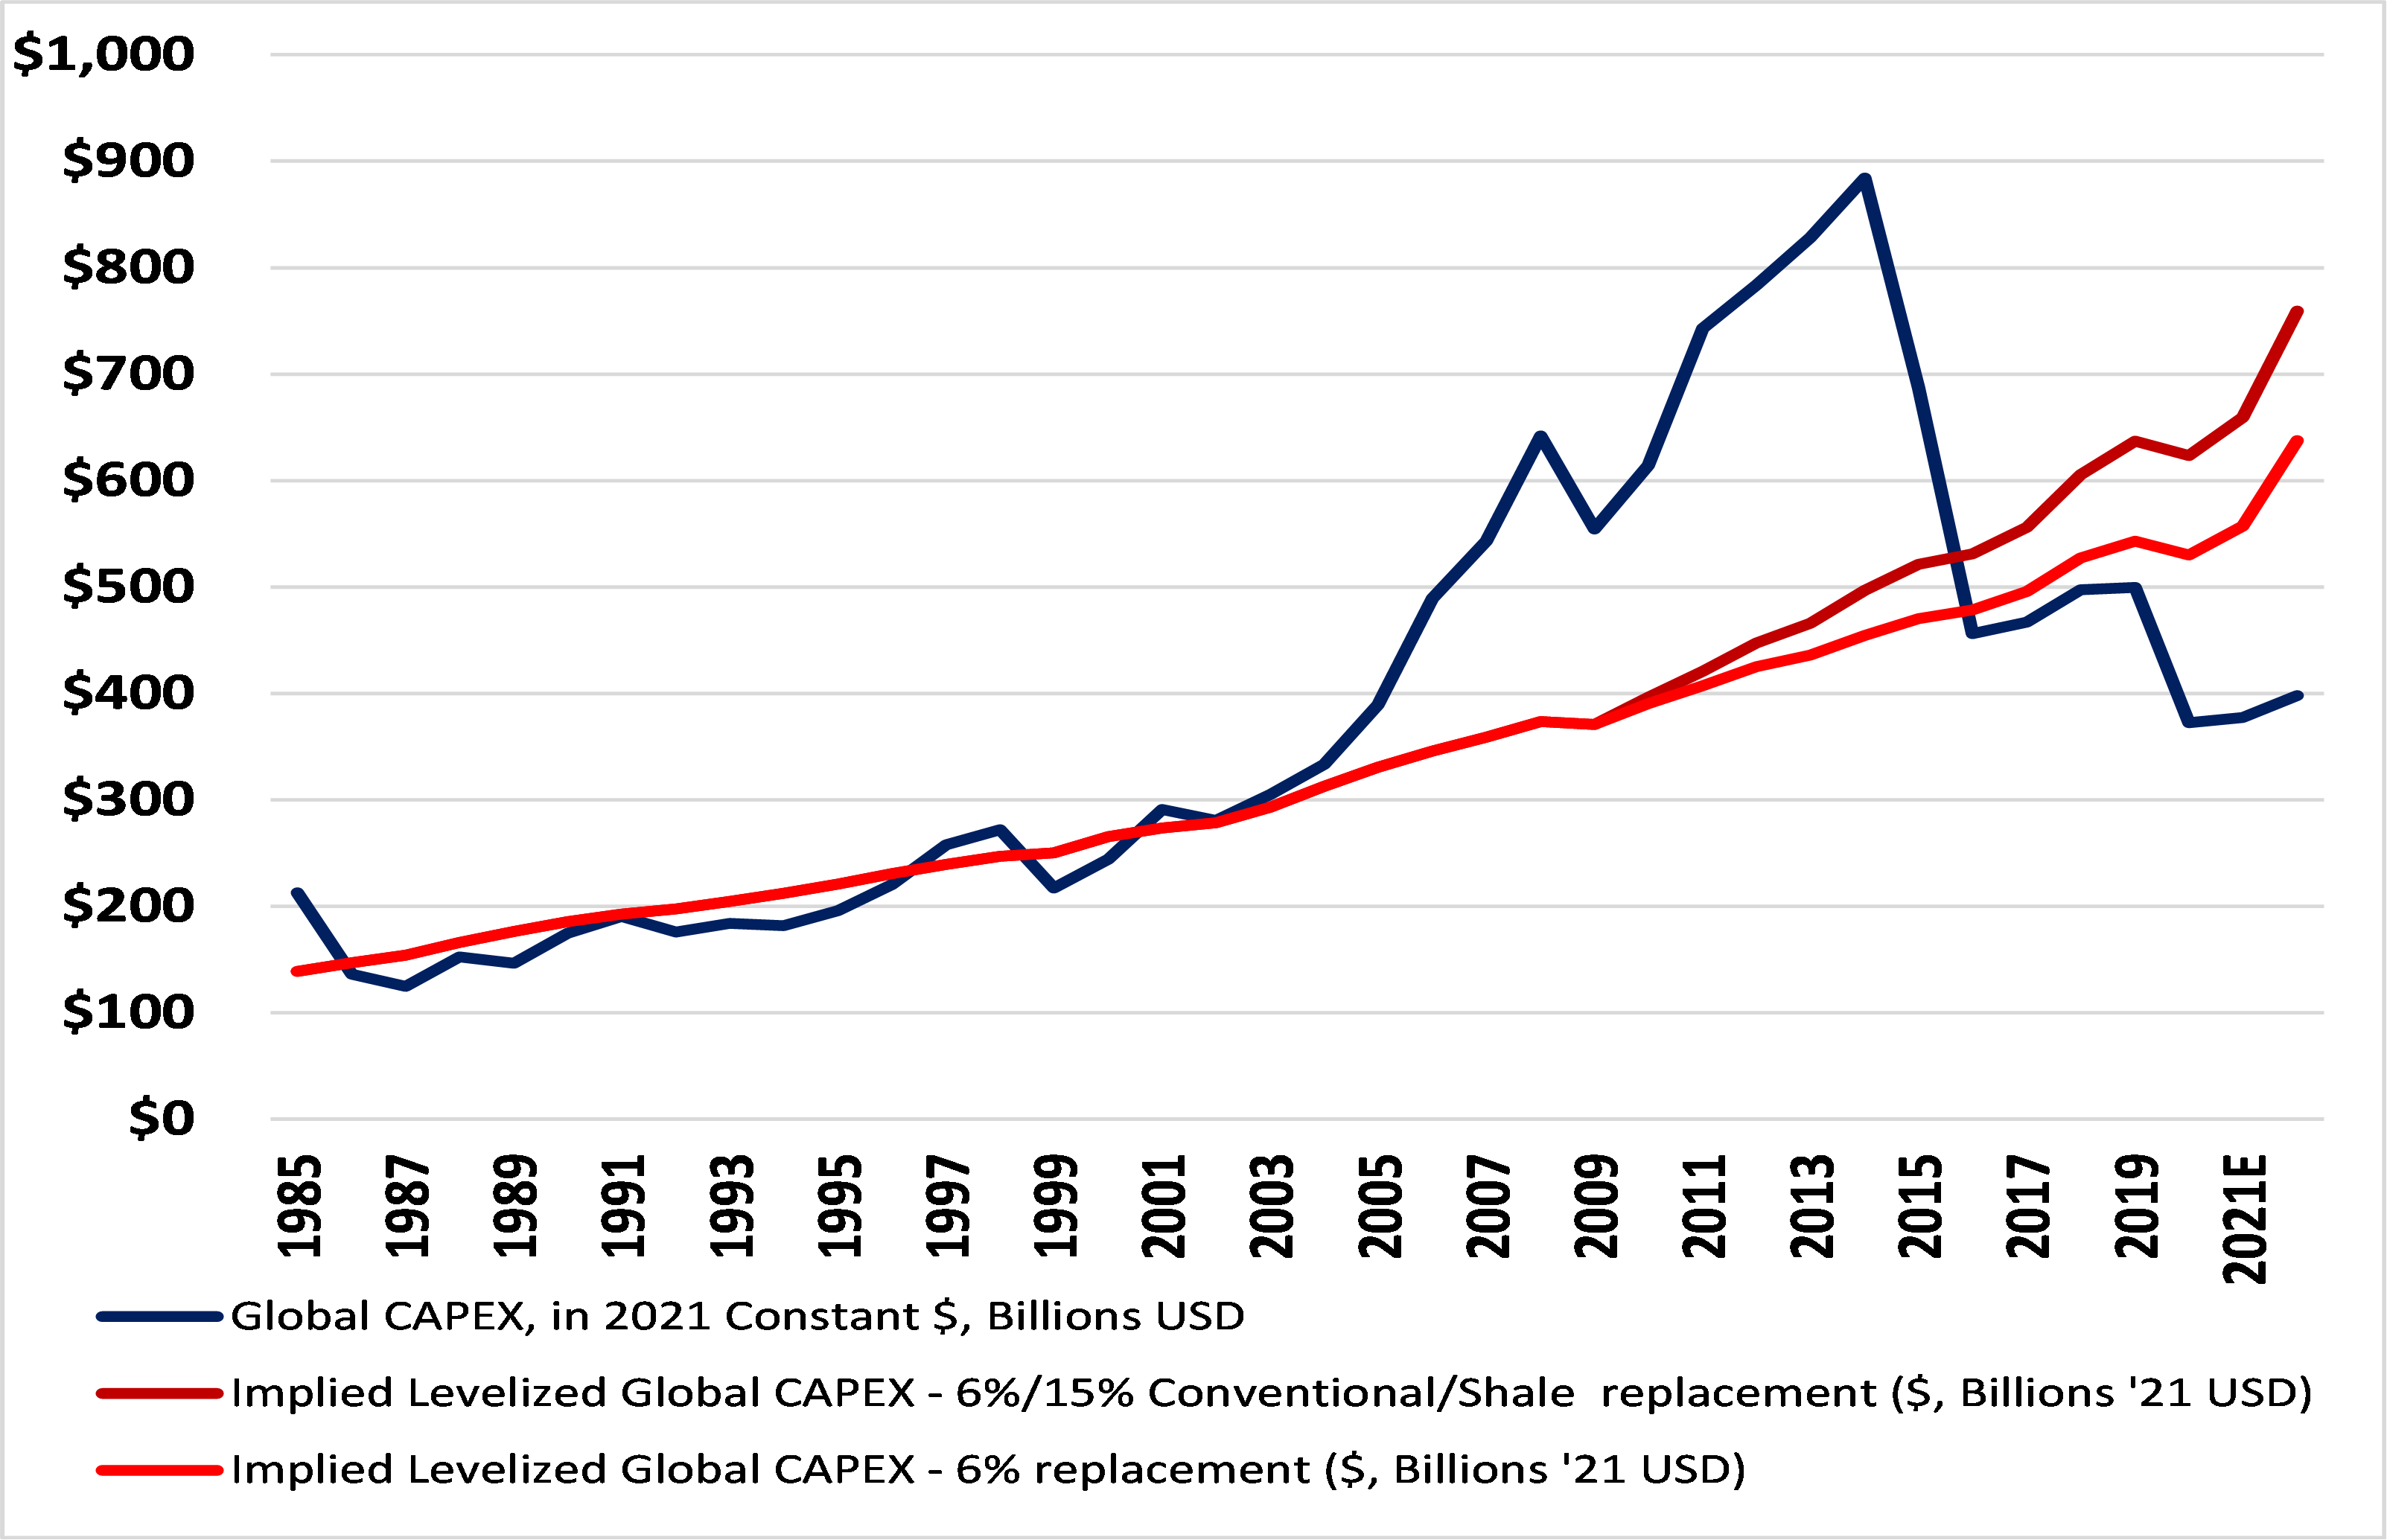
In Exhibit 4, we adjust the red line in Exhibit 2 for a faster global decline rate due to the growth of U.S. shale as a portion of global oil and gas production capacity[4].
Exhibit 4 – Global Oil and Gas Capital Spending vs Estimated Sustaining Capital – Adjusted for Shale.
Sources: Evercore ISI Research (using a compilation of Company Data, Salomon Brothers, Salomon Smith Barney, Lehman Brothers, Barclays Capital, and Evercore ISI Research estimates), U.S. Bureau of Economic Analysis, EIA, EIP estimates.
With this adjustment, the shortfall between actual capital spending and what is needed to maintain production capacity becomes even larger.
That brings us to the IEA Report showing that capital spending for oil and gas is expected to be up 10% in 2022 vs 2021 but adjusted for cost inflation is about flat. The IEA Report echoes what came through loud and clear in the first quarter 2022 earnings calls–that the supplies and manpower needed to increase activity are simply not available.[5]
To be sure, activity levels are up off their pandemic lows, but as shown in Exhibit 2, those levels of capital spending are insufficient to offset natural field declines which can range from as low as 5% in mature conventional oil and gas fields and up to 30-60% for newer wells in the Permian Basin.[6] Said another way, the industry’s capital spending cycle created a supply deficit hole that needs time and a lot more capital to climb out of. Shareholder demands for return OF capital in place of past (unfulfilled) promises for a return ON capital is, in our view, the primary impediment to supply growth, and will remain so even after supply chain and employment shortfalls begin to normalize.
But what about government policy and ESG demands from investors? We have written already in our blog post “The Blame Game” about how the political right is blaming higher prices on the political left’s desire for more clean energy and how the political left is blaming the current situation on not enough spending on renewables by the political right. While these dynamics may be of some small consequence, they pale in comparison to an industry capital spending cycle described above that indicates a need for capital spending increases of over 50%.
While ESG investors who are more focused on the “E” than the “S” might like to keep capital spending low, so too do traditional investors who want returns to rise before loosening the purse strings. It is hard to quantify the relative contribution of these two distinct shareholder groups, but the conclusion is the same: investors should keep their eye on capital spending numbers and ignore most of the verbs, nouns and adjectives being thrown around in the political arena.
Let’s shift now to the demand side where questions about the energy transition leading to declining use of oil and natural gas can be addressed.
Demand Side
The BP Report [7] states that demand for primary energy (which includes oil, gas, coal, nuclear, hydro, renewables, etc.) was up 2.3% in 2021 vs 2019.[8] Demand being higher today in mid-2022 vs 2019 may not be headline news, but 2021 was still a recovery year that started out with significantly lower energy demand induced by the pandemic. More interesting is the material difference between oil (65% of which is used for transportation) on the one hand and fuels used primarily for power generation, space heating and industrial production on the other. Oil demand was down 4.0% in 2021 vs 2019 while all other primary energy was up 5.5%. Despite this 4% decline, oil prices averaged about $70 per barrel (Brent) in 2021 before transport demand had fully recovered. That compares to $58 per barrel (Brent) in the five years before the pandemic[9].
While oil and natural gas demand may be facing near term headwinds today because of the recent spike in prices, the longer-term trend has been for growth of about 1.2% annually for oil and 2.4% for natural gas.[10] During the pandemic, many observers attributed a drop in demand for oil and gas to growth in electric vehicles (EV) and renewables, primarily wind and solar. The BP Report data for 2021 and U.S. Dept of Energy Data for 2022[11] shows that these observations were just wrong and here’s why.
Let’s start with EVs and their impact on oil demand, about 65% of which is for transportation of all kinds: passenger cars, trucks, trains, ships and planes. Passenger cars are about 30 of the 65 percentage points.[12] In a prior blog post found here, we presented our conclusions about how the continued growth in the vehicle fleet (which is still over 95% internal combustion engine (ICE)) and a scrappage rate of about 4% results in a very slow and deferred impact on the on-road fleet from sales of new EVs which are accelerating rapidly. In that exercise, we made two very aggressive and unrealistic assumptions. First, that EVs will account for 50% of global passenger sales of new vehicles in 2030 and 100% in 2035. Second, that all other forms of transportation would follow a similar path. Even with these assumptions that are more accelerated than any forecast that we can find (and quite frankly not feasible), oil demand remains higher in 2030 than 2019. Nothing in the recent demand data suggests that this conclusion is not on target.
That brings us to renewables. Renewable growth is coming primarily from wind and solar and secondarily from hydro and biofuels. Therefore, the vast majority of growth in renewables is for electric power generation. As such, there is virtually zero impact on oil demand growth because only 3% of oil consumption is used for electric power generation[13].
Renewable market share growth so far, has come primarily from coal and nuclear, while natural gas demand continues to grow. Natural gas grew at a 1.7% annual rate between 2019 and 2021.
Exhibit 5 shows the growth rates for coal, natural gas, and non-hydro renewables for the last 20 years.
Exhibit 5 – Growth rates for Coal, natural Gas and Non-Hydro Renewables
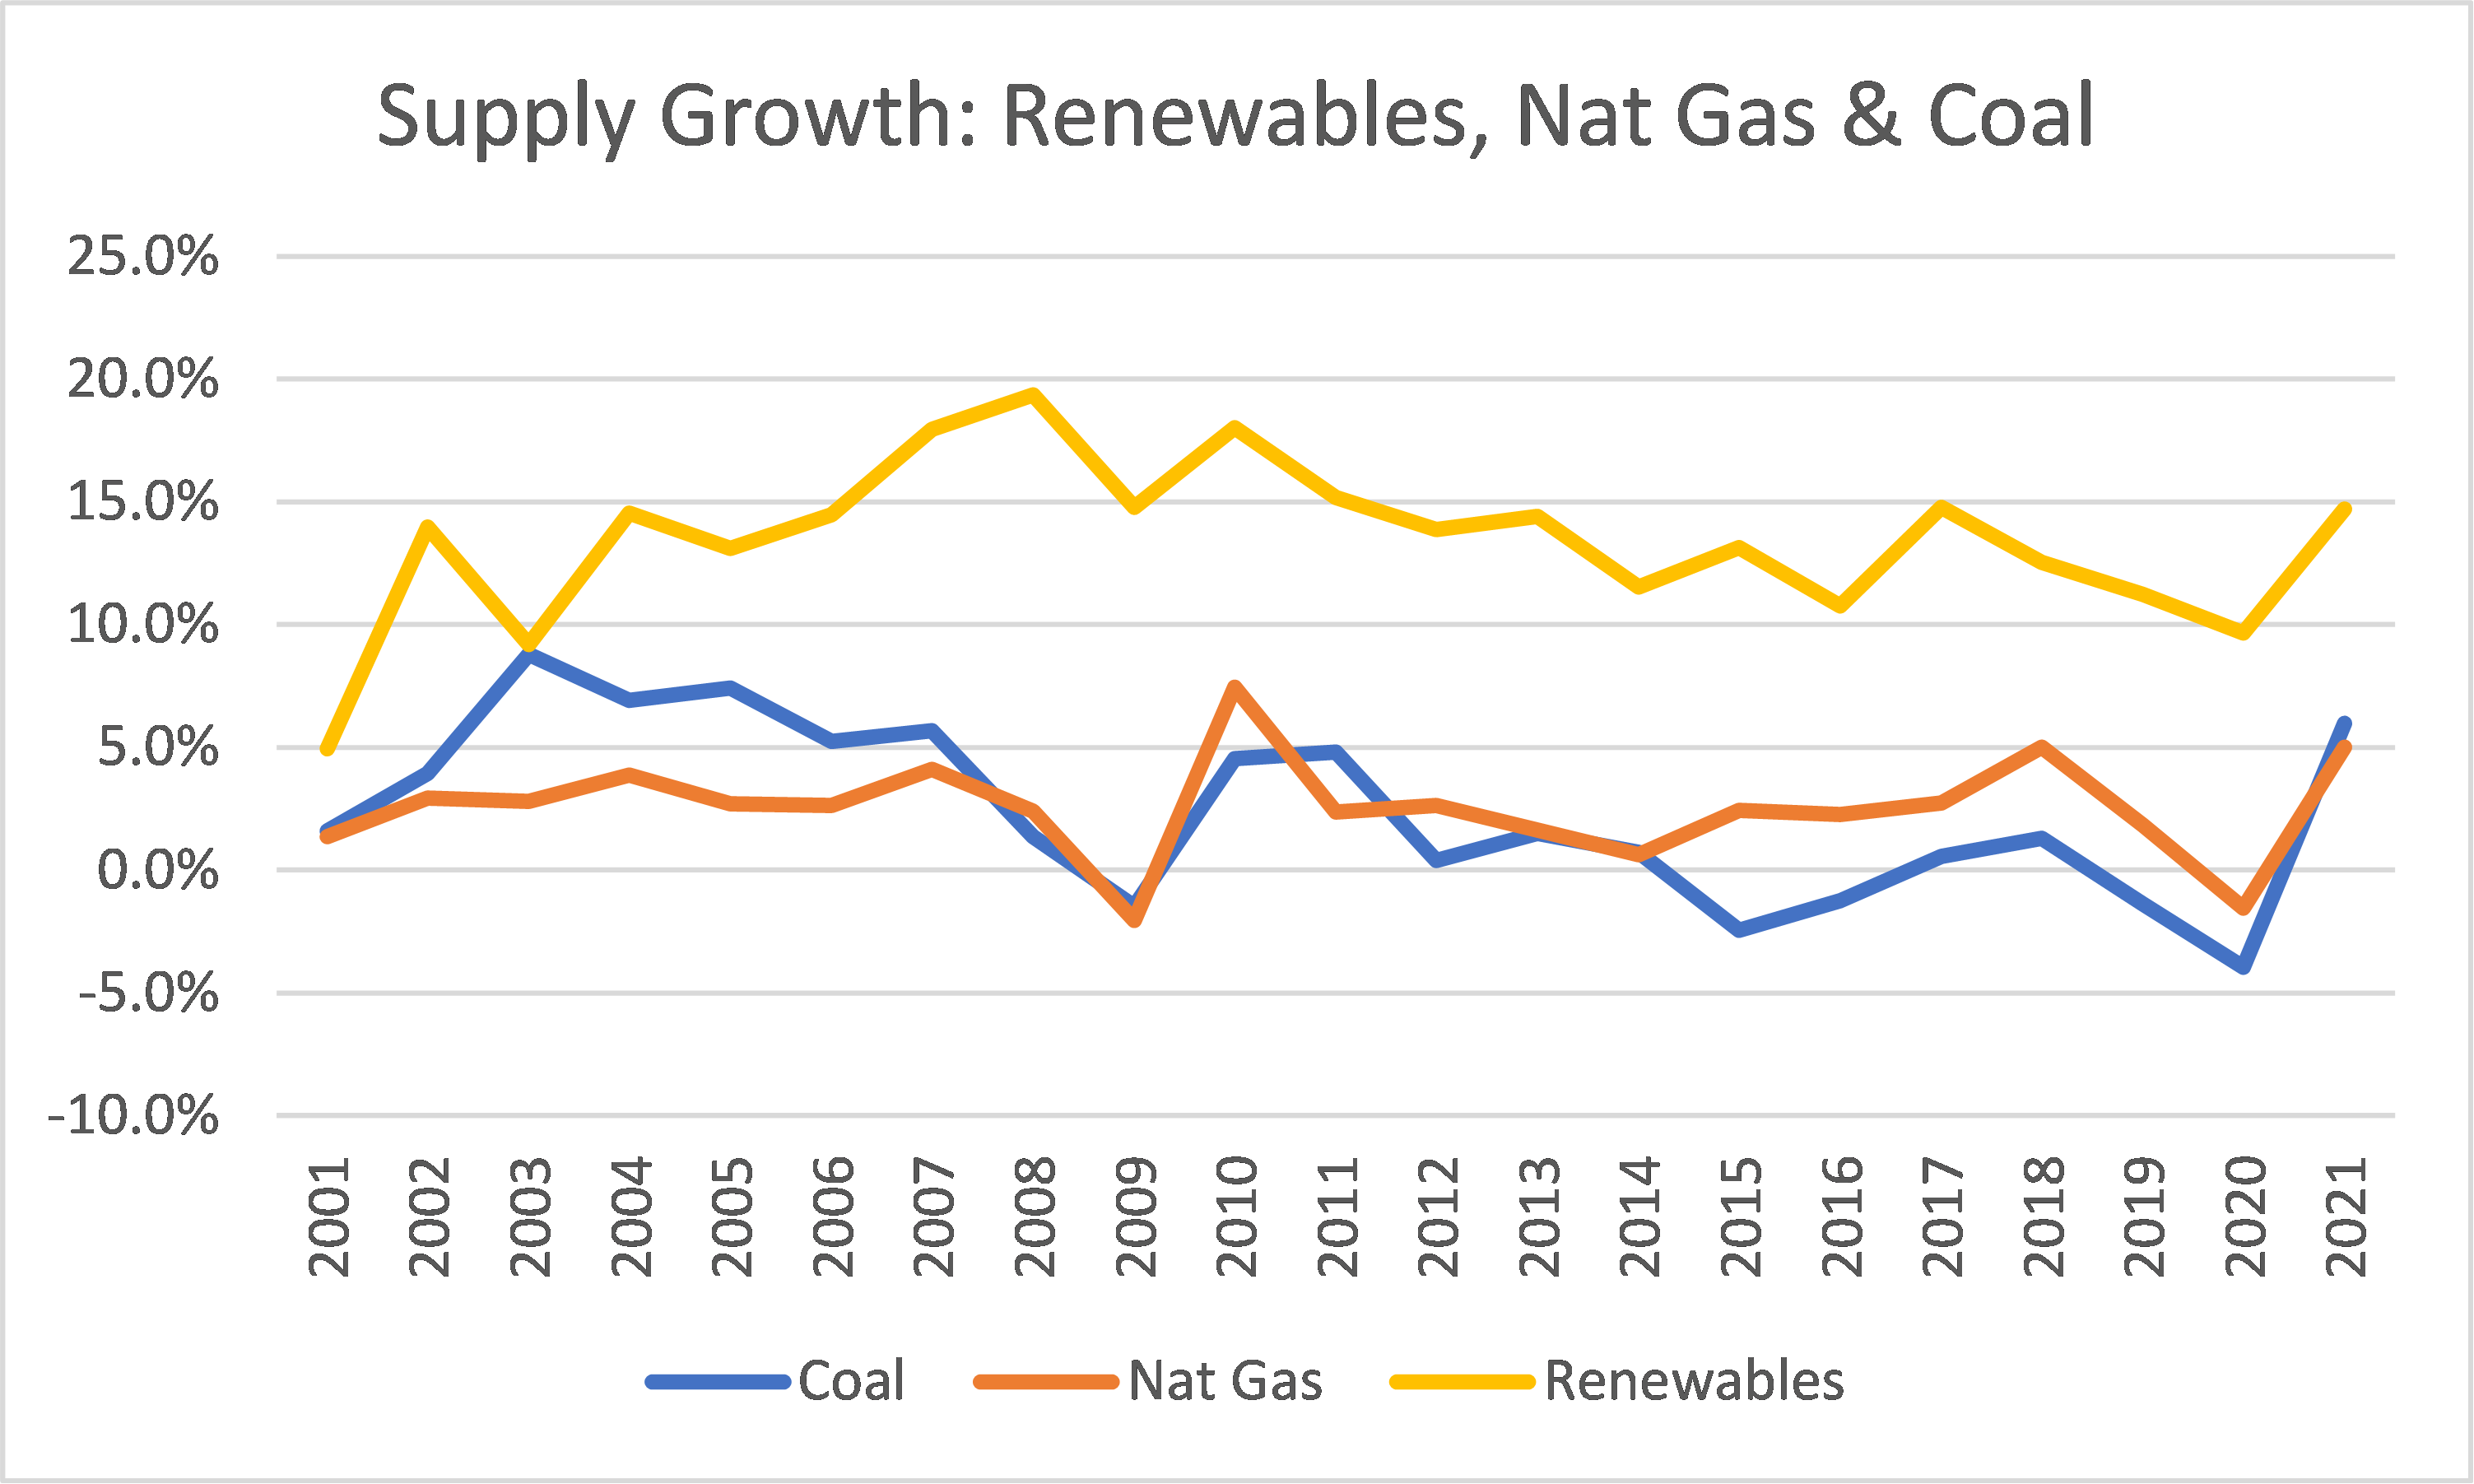
Source: bp Statistical Review of World Energy – June 2022 Report
Going forward, it makes sense that renewable growth will mostly affect demand for other sources of electric power generation: coal, hydro, nuclear and natural gas. But since nuclear and hydro are zero carbon power sources and natural gas remains essential to stabilizing the grid and balancing the inherent variability of renewables, in our opinion, it seems reasonable that virtually all the market share ceded to growing renewables will come out of coal. Here is another reason: only ~40% of global natural gas demand is for electric generation while over 75% of global thermal coal demand is for electric generation[14]. Even assuming renewable penetration cut into natural gas and coal electric generation equally, coal demand destruction would still be nearly two times that of natural gas because of these end use ratios. And while coal prices have spiked along with oil and gas prices, the IEA Report shows capital spending on coal production is not rising faster than cost inflation.[15]
Bringing It All Together
Using these factors and recent trends, we decided to look at demand for primary energy over the next ten years as shown in Exhibit 6. As a guide, primary energy demand has been growing at about 61% the rate of global GDP as the world’s economy becomes more service oriented and less industrial over time[16]. So, in making this forecast we assumed primary energy demand would only grow about 1.4% per year, slightly slower than the 1.6% rate of last ten years or so.[17]
Exhibit 6 – Global Primary Energy Consumption

Source: bp Statistical Review of World Energy – June 2022 Report – Long Term Growth spans from pre-Global Financial Crisis to Pre-Pandemic in order to normalize for two large macro events.
For oil, we used our modeling conclusions from our global vehicle fleet analysis which, as we have said, is more aggressive in EV adoption than any forecast we can find. We assume that coal resumes its declines experienced prior to the pandemic and the War in Ukraine. We assumed nuclear power continues recent trends where retirements and a few new plants offset each other. We assumed hydro continues to grow slightly below its historic rate. Its growth rate has been in decline for a long time as the world runs out of new rivers to dam up. Other renewables are assumed to continue at the high end of their recent growth rate of 15%, even though the trend in that rate of growth is in decline as the denominator gets larger. We then adjusted the growth rates for natural gas downward until total primary energy demand grows at 1.4%.
Conclusion: oil and gas demand are higher in 2030 than 2021.
This analysis is simple in its construct because the law of large numbers means that forecasting an endless list of hypothetical scenarios is largely a waste of time for the 8 years between now and 2030. The value of the exercise is that it reveals how difficult it will be to bend the trend in demand for oil and gas from positive to negative. Other than EVs for passenger cars and an EV/Fuel cell solution for trucks, trains and ships, there is no technology that can have a material impact on the 65% of oil demand used for transportation in the next 8 years. Other than wind and solar, there is no technology that can have a material impact on electric power supply over the next 8 years.
The IEA Report goes into a lot of detail about capital spending on renewables which has grown at an annual rate of about 8% over the last 6 years in constant dollars. If depreciation is zero that would drive an 8% growth in the capacity level, far below our assumed 15%. However, wind and solar production also experience natural decline over time and if, in fact, renewable depreciation is 3% (implying a 33-year life), in our opinion, capital spending would need to grow 18% annually to maintain a 15% growth rate. This is the growth rate implied by the Announced Pledge Scenario laid out in the IEA Report and represents capital spending on renewables that is about 70% above current levels. Moreover, cost inflation of about 18% for solar and about 8% for wind over the last year according to the IEA Report mean nominal spending must accelerate dramatically just to keep up. Nonetheless, as with our EV modeling, we are assuming a highly optimistic growth rate in renewables just to flex the model to determine the impact on demand for other sources of power generation.
Even if we accelerate renewable supply growth to 20%, the conclusions don’t change; coal will suffer the most and natural gas demand will still be the same in 2030 as it is today.[18] And if renewables were to grow by 20% per year for the next 8 years, renewable energy supply would become the largest source of primary energy at over 200 exajoules. While there are a lot of arguments as to why wind and solar power and the associated demand for battery storage make such an outcome infeasible (supply chain, resource security, grid reliability, NIMBYism, etc.) this analysis indicates continued growth in oil and gas demand even if all of those impediments to renewable growth are solved at a competitive cost. In our opinion, the only way natural gas demand can decline over the next decade is if coal usage rises over time versus recent trends.
Of course, there are always near-term anomalies that affect the longer-term trends. Reduced Russian natural gas exports being the obvious one. Another would be an accelerated restart of nuclear generation in Japan.
The energy system is massive, mostly privately owned and operated, and is indispensable to the world economy. Making changes to that system to compensate for the normal capital spending cycle, supply interruptions due to wars and pandemics or the need to reduce its carbon emissions takes a lot more than meetings by top government officials and the aspirational goals that come out of those meetings. It requires a fundamental knowledge of how the system actually works, what incentives suppliers and customers actually respond to, and the political will and public support to implement policies that actually affect the very mechanisms that drive this massive system.
This analysis shows that if trends in the so-called energy transition continue or even accelerate, oil and gas demand will still grow, nuclear will likely remain flat and coal demand will likely resume its decline. No wonder the European Union recently decided to embrace natural gas and nuclear as “sustainable” sources of energy. Because without them, the world economy is not, well, sustainable.
[1] Evercore ISI Research (using a compilation of Company Data, Salomon Brothers, Salomon Smith Barney, Lehman Brothers, Barclays Capital, and Evercore ISI Research estimates), U.S. Bureau of Economic Analysis, EIA, EIP estimates.
[2] Notice that the sustaining capital line exceeds actual capital spending in the late 1980’s through early 1990’s following the oil price collapse in 1986. In part, the huge increases in oil prices in the mid-2000s were a result of 15+ years of underspending. Also, the estimated sustaining capital of $22-25 per barrel in then-current dollars matches the industry’s estimates for a normalized cost-based oil price forecast. Source: EIP estimates.
[3] Bloomberg, EIA
[4] We assumed shale production declines at 15% annually, much lower than most industry analysts would use.
[5]International Energy Agency: World Energy Investment 2022 Report
[6] Evercore ISI Research (using a compilation of Company Data, Salomon Brothers, Salomon Smith Barney, Lehman Brothers, Barclays Capital, and Evercore ISI Research estimates), U.S. Bureau of Economic Analysis, EIA, EIP estimates.
[7] bp Statistical Review of World Energy – June 2022 Report
[8] Ibid
[9] Bloomberg
[10] bp Statistical Review of World Energy June 2022 Report – CAGR 2007-2019
[11] U.S. Dept. Of Energy data on Total Products Supplied
[12] EIA, IEA, Statista, Enterprise Products Partners May 2022 investor deck and EIP estimates
[13] Ibid
[14] IEA. Gas data from 2013-2019. Coal data from 2021.
[15] IEA World Energy Investment 2022 Report page 101
[16] As Alan Greenspan was fond of saying “GDP gets lighter every year.”
[17] From 1990-2001 the ratio of the CAGR for primary energy to global GDP is 61%. The CAGR for global GDP over this time is 3.0%. If global GDP continues to grow at 3% and the ratio between primary energy and GDP remains constant, primary energy demand growth would be 1.8%, not the 1.4% we are assuming. This would raise the growth rates for future natural gas demand. Source: World Bank and bp Statistical Review of World Energy.
[18] We assume in this scenario that coal demand declines 5% until 2025 and 12% thereafter while natural gas continues to grow at 1.5% until 2025 and then declines at 1.5% until 2030. These assumptions result in primary energy growth of 1.4% and natural gas demand of 143 exajoules, roughly equal to 2021 demand of 145 exajoules.
The information provided above is based on data obtained from third party publicly available sources that EIP believes to be reliable, but EIP has not independently verified and cannot warrant the accuracy of such information. In providing the information, EIP has made several assumptions that if changed, materially affect the information and conclusions provided. This information is based upon EIP’s opinion which may change at any time and without notice.